This was written prior to eclipse day as I was contemplating how to compare the two image sets. I include it here to keep the thought sequence intact.
When we apply steps EE-1, 2, and 3 to both the before images and the during images, we will have a set of radial distances to compare. In the best of conditions, the distances will be very close to each other. There will be measurement noise and it is unlikely that the subpixel difference we are looking for will be immediately obvious from the measurement of any single reference star.
There are some tests we can make ahead of time to see what to expect. For example, we can compare an image taken on different (before) dates to see if they show consistent positions of the reference stars. We can compare images taken in a single session to measure the effects of atmospheric seeing and other factors.
To this end, I have made various images of this field of the sky over the months preceding the eclipse. They are among the least interesting of the astrophotos I have ever taken, since they show a single bright star (Regulus), and not much more. There are no deep sky objects of interest in this particular patch.; no galaxies, no nebulas, no star clusters, no Milky Way field. However, there are stars that can be detected, even in metropolitan light pollution, that match up with the Stellarium reference star database.
I took exposures for two consistency tests. One is multiple exposures of the same exact scene, with no changes in any settings. Ideally, the images would be identical, but if not, would be a measure of the dynamic atmospheric distortions, or perhaps the mechanical vibrations of my camera-telescope-tripod setup.
The second test changes the camera angle. The center of view remains approximately the same, but the camera rotates to 45 and 90 degrees. Each change requires a re-focus. If my frame centering and lens radial corrections were accurate, the stars should remain in the same locations.
Even if my lens corrections were imperfect, the first test: multiple exposures with no changes, should pass. Perhaps the lens corrections did not place the detected stars at their exact reference locations, but at least they should all fall at the same place. I could compare them against their reference, which might show an error, but if I compare them against each other, the differences should vanish.
The second test, comparing images of the same field but at different angles (portrait vs landscape etc), is a simulation of pictures taken at different times. It is a “best case” test: everything is the same except the camera was rotated and refocused, compared to the real-world case for the “after” image where not only is the angle different, the telescope alignment will have a slightly different center, the angle in the sky (and its atmospheric refraction) will be different, the temperature, elevation, and air pressure will be different, and many other uncontrolled (and unknown) variables will differ from those of the before image. This test tells us the best we can expect from comparing before and during images.
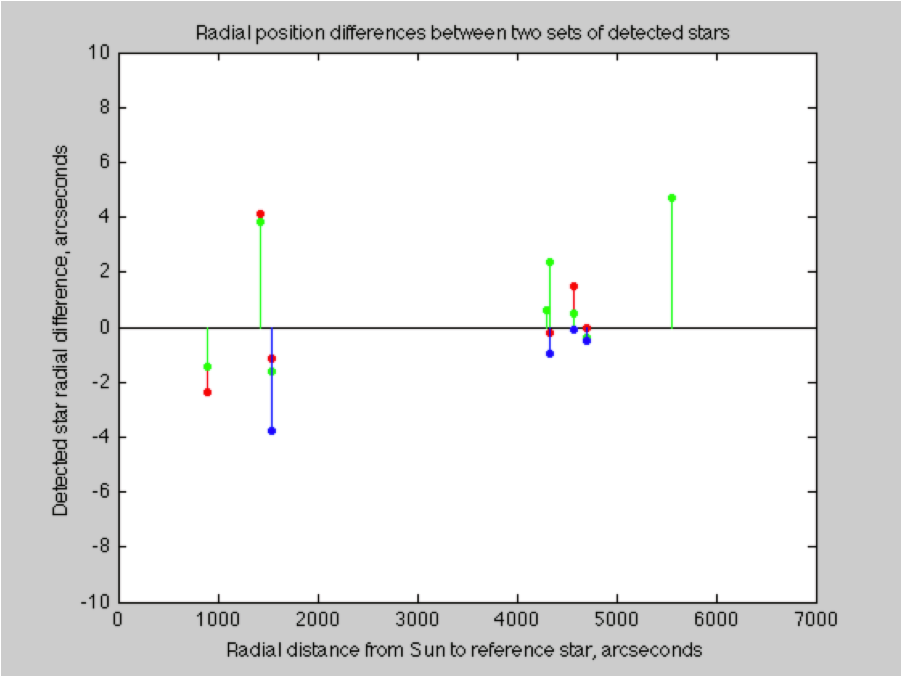
Here are the results of the first test, where a second image is compared to the first, all else being equal. The stars should be detected at the same exact positions, and yet they aren’t.

The differences between the positions of the same stars in two successive exposures. There are approximately eight stars detected (in green, fewer in the other channels). This is an indication of the variations introduced by the atmospheric seeing.
The standard deviation of this comparison was 2.3 arcseconds. The comparisons of other successive frames yielded standard deviations of 2.1 and 1.6. It appears that the consistency of star positions as detected by my equipment is about 2 arcseconds. This is consistent with reports of the atmospheric seeing in Minnesota.
I was curious about how to characterize “seeing” and found these interesting links (there is always too much to explore and investigate to the depth I would like):
Astronomical Seeing Part 2: Seeing Measurement Methods
https://www.handprint.com/ASTRO/seeing2.html
Lucky Exposures: Diffraction Limited Astronomical Imaging Through the Atmosphere
http://www.mrao.cam.ac.uk/projects/OAS/publications/fulltext/rnt_thesis.pdf
There is another domain of relevant knowledge: how to determine if the distribution of observations is the same, or different, from another. I will be comparing position measurements from the “before” condition to the “during” condition when the sun’s gravity will have a possible influence. How can we tell if the measurements are from truly different conditions, rather than the normal variations caused by noise? Here are some links I explored to try to answer this question:
Are Two Distributions Different?
http://www.aip.de/groups/soe/local/numres/bookcpdf/c14-3.pdf
Goodness of Fit Tests
http://www.mathwave.com/articles/goodness_of_fit.html
Tests of Significance
http://www.stat.yale.edu/Courses/1997-98/101/sigtest.htm
