Analyzing Eclipse Day Results

I was able to obtain 35 photos during totality that were candidates to locate stars in the field. The exposures ranged from 1/60 to 2 seconds, but it became clear after applying the detection procedure starPos.m, that only the longest exposures, 1 and 2 seconds, would yield detected stars. The inner regions of the corona were just too bright and irregular for the algorithm to find them.

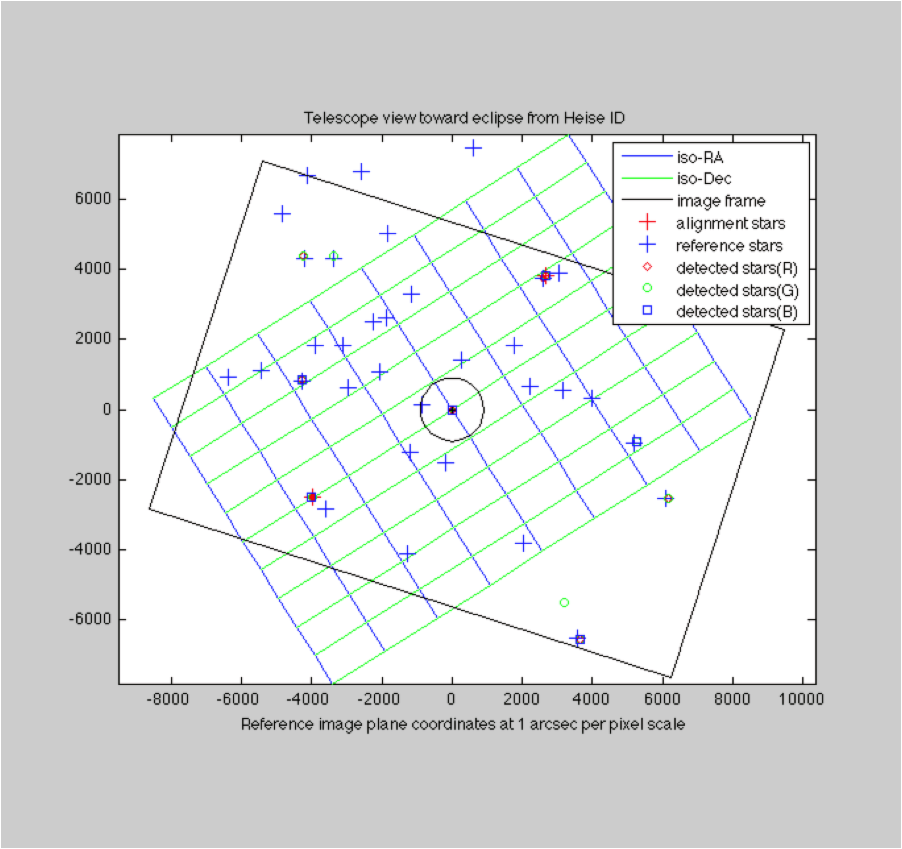
This left 15 images to work with. The camera orientation was good in that there were many candidate reference stars in the frame. Here is the mapping of a mid-eclipse exposure (3496):

analysis.1


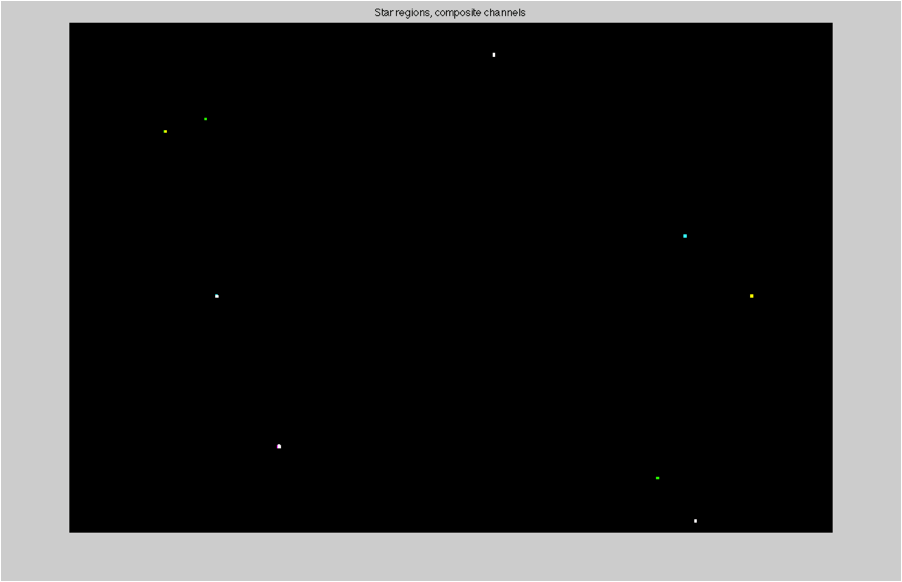
Here is a map of the located stars. The color codes indicate the channels (red, green or blue) in which the star was found. White indicates being found in all channels. The number of located stars for this image are: 6 red, 9 green, 5 blue.

analysis.2


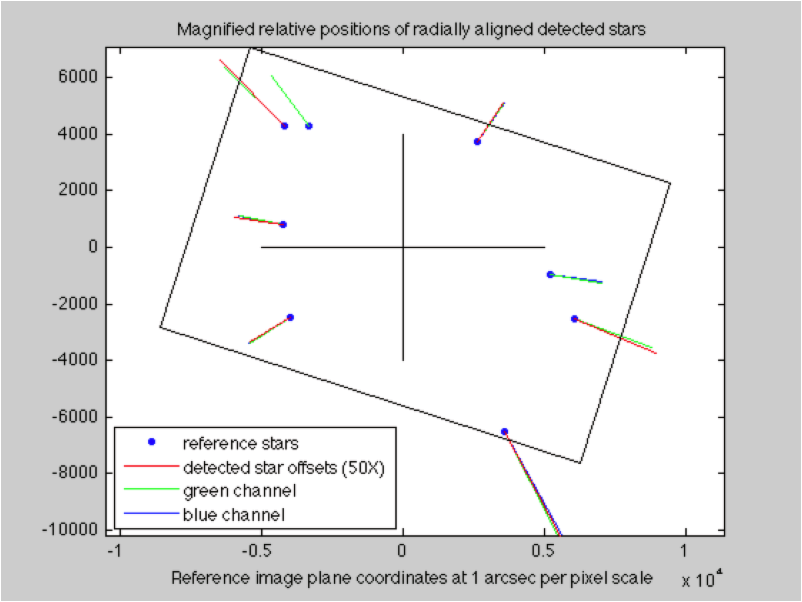
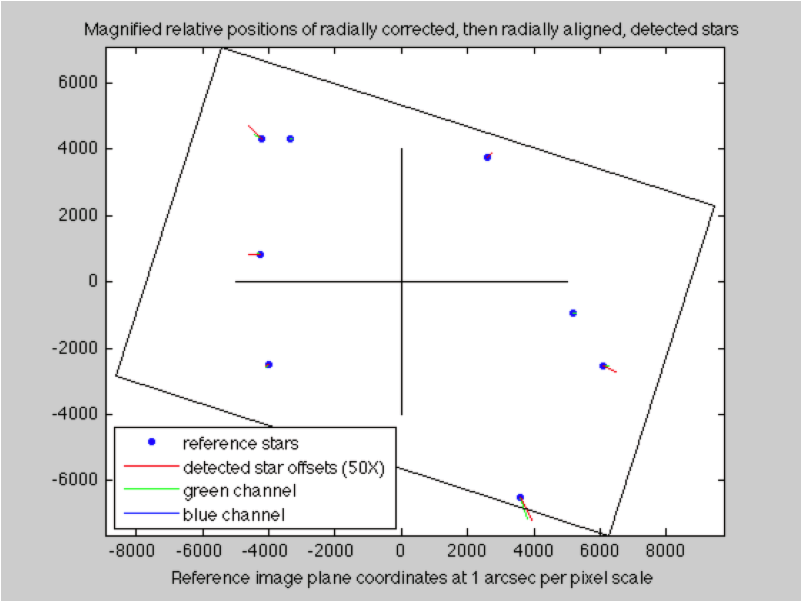
The detected stars are then mapped to our virtual camera view and correlated against our list of reference stars (imagePos.m). They are then more precisely aligned to the center of the sun. The lens distortion is removed at this stage (radialAlign.m).

The uncorrected lens positions look like this:

analysis.3

Lens corrected:

analysis.4

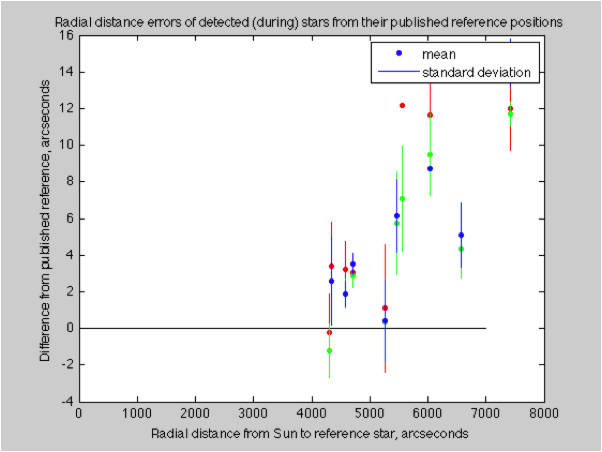
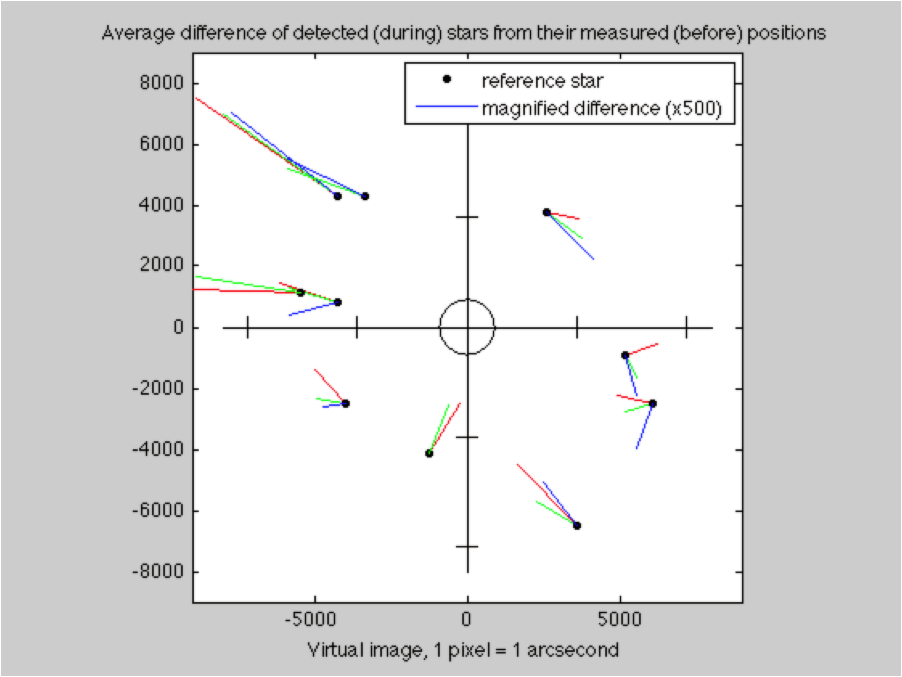
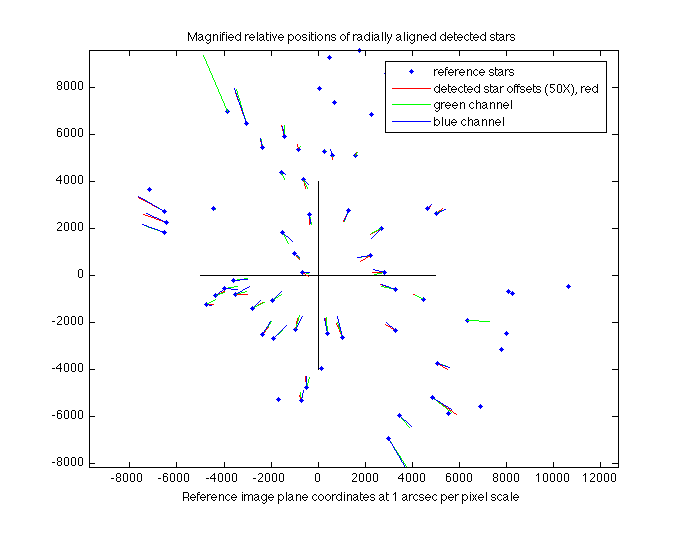
The errors are still rather large, but by collecting the statistics from all of the “during” frames, we can see how they land with respect to their published reference positions. The standard deviations are consistent with atmospheric seeing, but the differences in average positions indicates other sources of error.

analysis.5


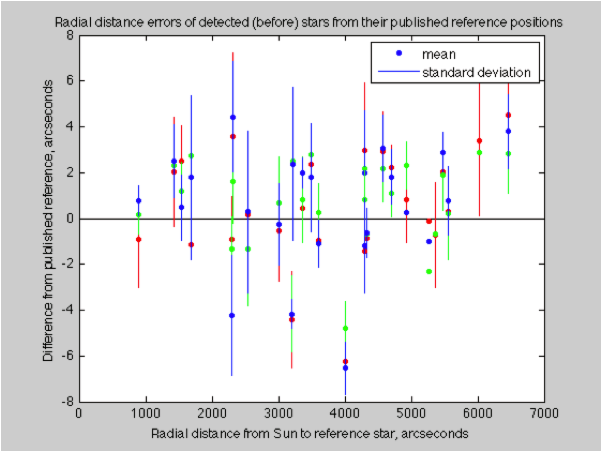
If we average all of the “before” images I took, and see how they compare to the published star locations, we get a similar wide ranging plot, the variances are again consistent with the seeing (but the average errors are not):

analysis.6


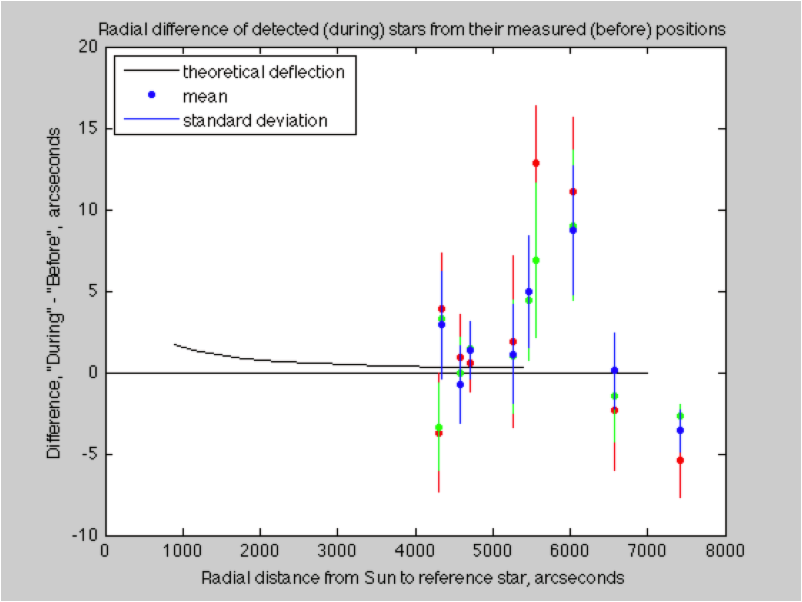
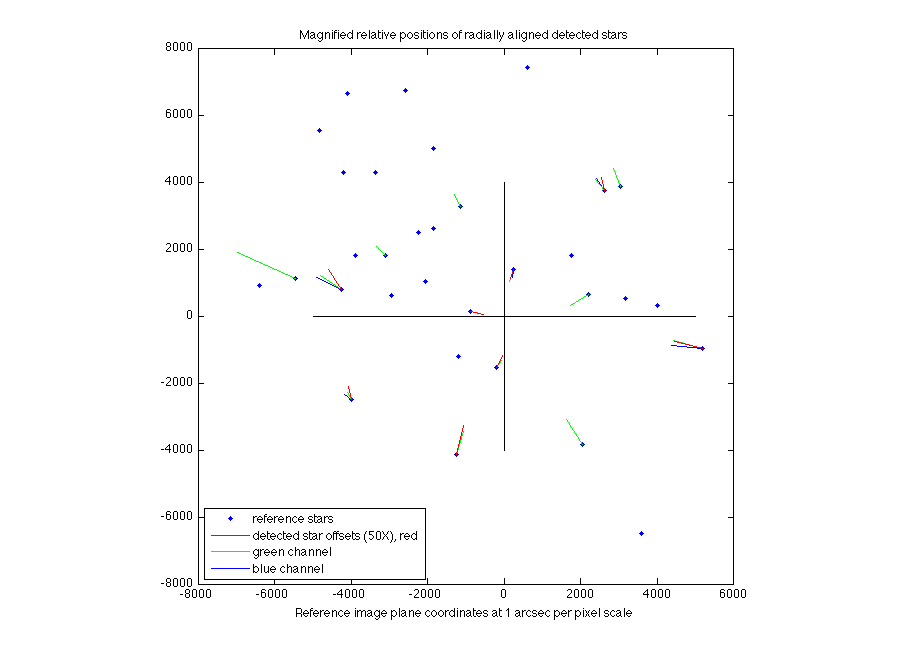
If we take the difference between these two data sets, we should see the gravitational deflection signal we are looking for. Unfortunately, it is lost in the noise.

analysis.7


I can make a plot similar to Eddington’s that shows the average measured deflection of these reference stars, but I will not claim that it demonstrates gravitational deflection.

analysis.8


Posted in Eddington Experiment | Leave a comment

Comparing Before and During images, step EE-4

This was written prior to eclipse day as I was contemplating how to compare the two image sets.  I include it here to keep the thought sequence intact.


When we apply steps EE-1, 2, and 3 to both the before images and the during images, we will have a set of radial distances to compare. In the best of conditions, the distances will be very close to each other. There will be measurement noise and it is unlikely that the subpixel difference we are looking for will be immediately obvious from the measurement of any single reference star.

There are some tests we can make ahead of time to see what to expect. For example, we can compare an image taken on different (before) dates to see if they show consistent positions of the reference stars. We can compare images taken in a single session to measure the effects of atmospheric seeing and other factors.

To this end, I have made various images of this field of the sky over the months preceding the eclipse. They are among the least interesting of the astrophotos I have ever taken, since they show a single bright star (Regulus), and not much more. There are no deep sky objects of interest in this particular patch.; no galaxies, no nebulas, no star clusters, no Milky Way field. However, there are stars that can be detected, even in metropolitan light pollution, that match up with the Stellarium reference star database.

I took exposures for two consistency tests. One is multiple exposures of the same exact scene, with no changes in any settings. Ideally, the images would be identical, but if not, would be a measure of the dynamic atmospheric distortions, or perhaps the mechanical vibrations of my camera-telescope-tripod setup.

The second test changes the camera angle. The center of view remains approximately the same, but the camera rotates to 45 and 90 degrees. Each change requires a re-focus. If my frame centering and lens radial corrections were accurate, the stars should remain in the same locations.

Even if my lens corrections were imperfect, the first test: multiple exposures with no changes, should pass. Perhaps the lens corrections did not place the detected stars at their exact reference locations, but at least they should all fall at the same place. I could compare them against their reference, which might show an error, but if I compare them against each other, the differences should vanish.

The second test, comparing images of the same field but at different angles (portrait vs landscape etc), is a simulation of pictures taken at different times. It is a “best case” test: everything is the same except the camera was rotated and refocused, compared to the real-world case for the “after” image where not only is the angle different, the telescope alignment will have a slightly different center, the angle in the sky (and its atmospheric refraction) will be different, the temperature, elevation, and air pressure will be different, and many other uncontrolled (and unknown) variables will differ from those of the before image. This test tells us the best we can expect from comparing before and during images.

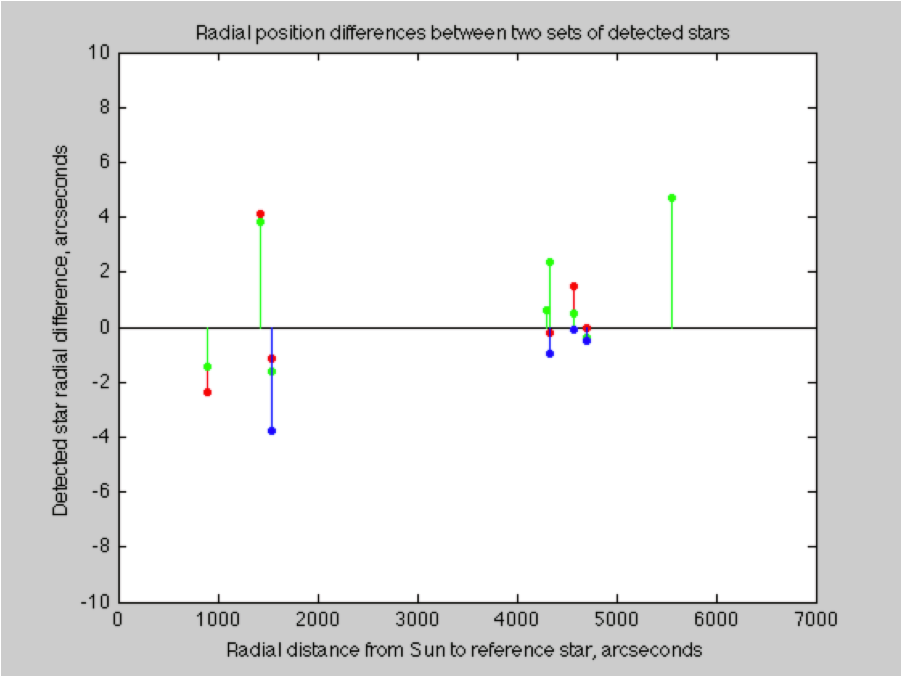
Here are the results of the first test, where a second image is compared to the first, all else being equal. The stars should be detected at the same exact positions, and yet they aren’t.
compareBeforeAndDuring

The differences between the positions of the same stars in two successive exposures. There are approximately eight stars detected (in green, fewer in the other channels). This is an indication of the variations introduced by the atmospheric seeing.


The standard deviation of this comparison was 2.3 arcseconds. The comparisons of other successive frames yielded standard deviations of 2.1 and 1.6. It appears that the consistency of star positions as detected by my equipment is about 2 arcseconds. This is consistent with reports of the atmospheric seeing in Minnesota.

I was curious about how to characterize “seeing” and found these interesting links (there is always too much to explore and investigate to the depth I would like):

Astronomical Seeing Part 2: Seeing Measurement Methods
https://www.handprint.com/ASTRO/seeing2.html

Lucky Exposures: Diffraction Limited Astronomical Imaging Through the Atmosphere
http://www.mrao.cam.ac.uk/projects/OAS/publications/fulltext/rnt_thesis.pdf


There is another domain of relevant knowledge: how to determine if the distribution of observations is the same, or different, from another. I will be comparing position measurements from the “before” condition to the “during” condition when the sun’s gravity will have a possible influence. How can we tell if the measurements are from truly different conditions, rather than the normal variations caused by noise? Here are some links I explored to try to answer this question:

Are Two Distributions Different?
http://www.aip.de/groups/soe/local/numres/bookcpdf/c14-3.pdf

Goodness of Fit Tests
http://www.mathwave.com/articles/goodness_of_fit.html

Tests of Significance
http://www.stat.yale.edu/Courses/1997-98/101/sigtest.htm


Posted in Eddington Experiment | Leave a comment

Corona tangent

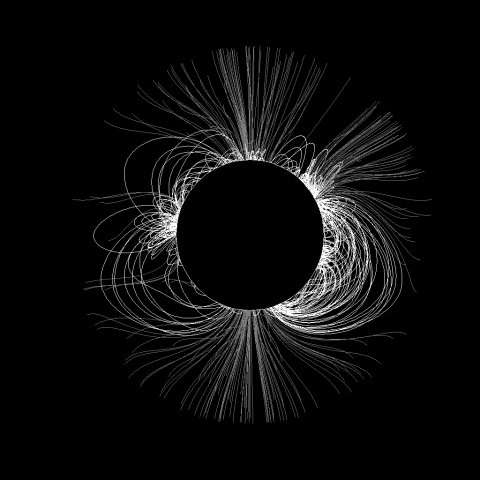
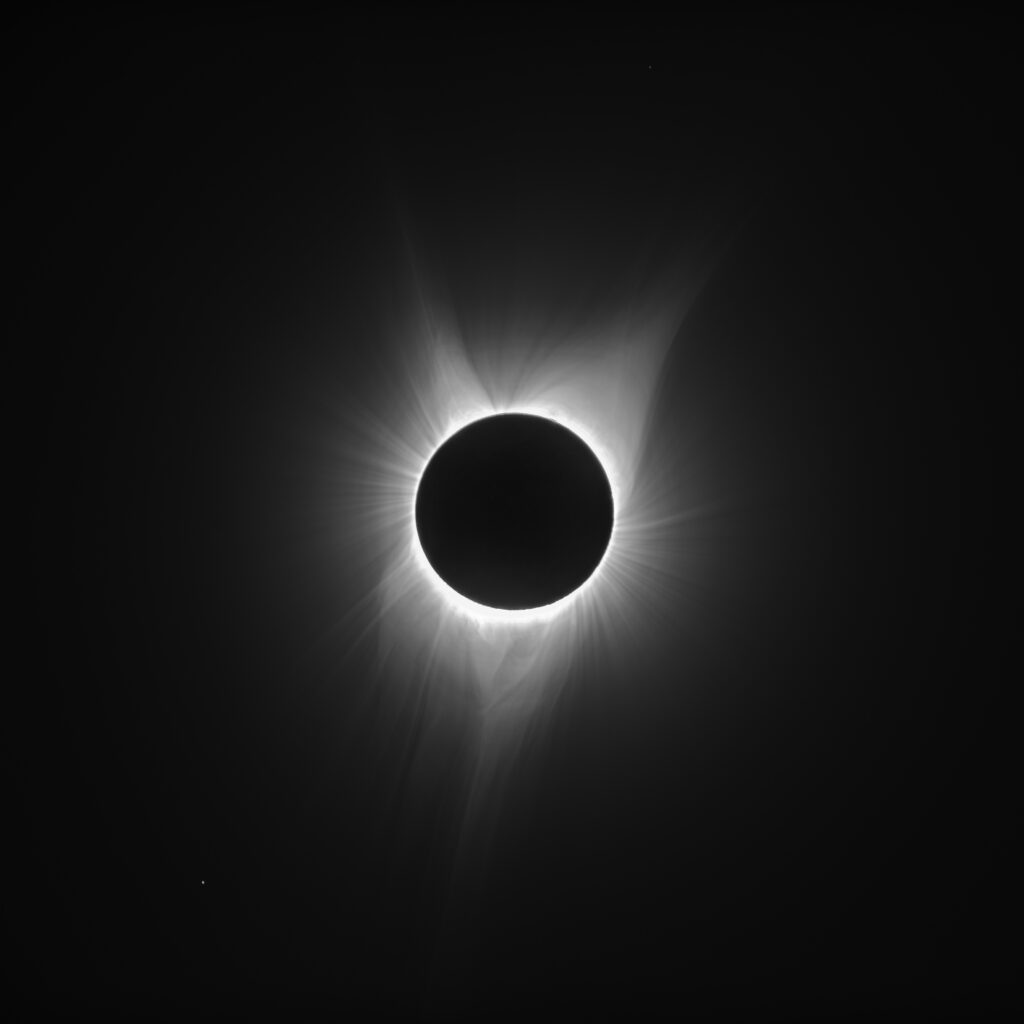
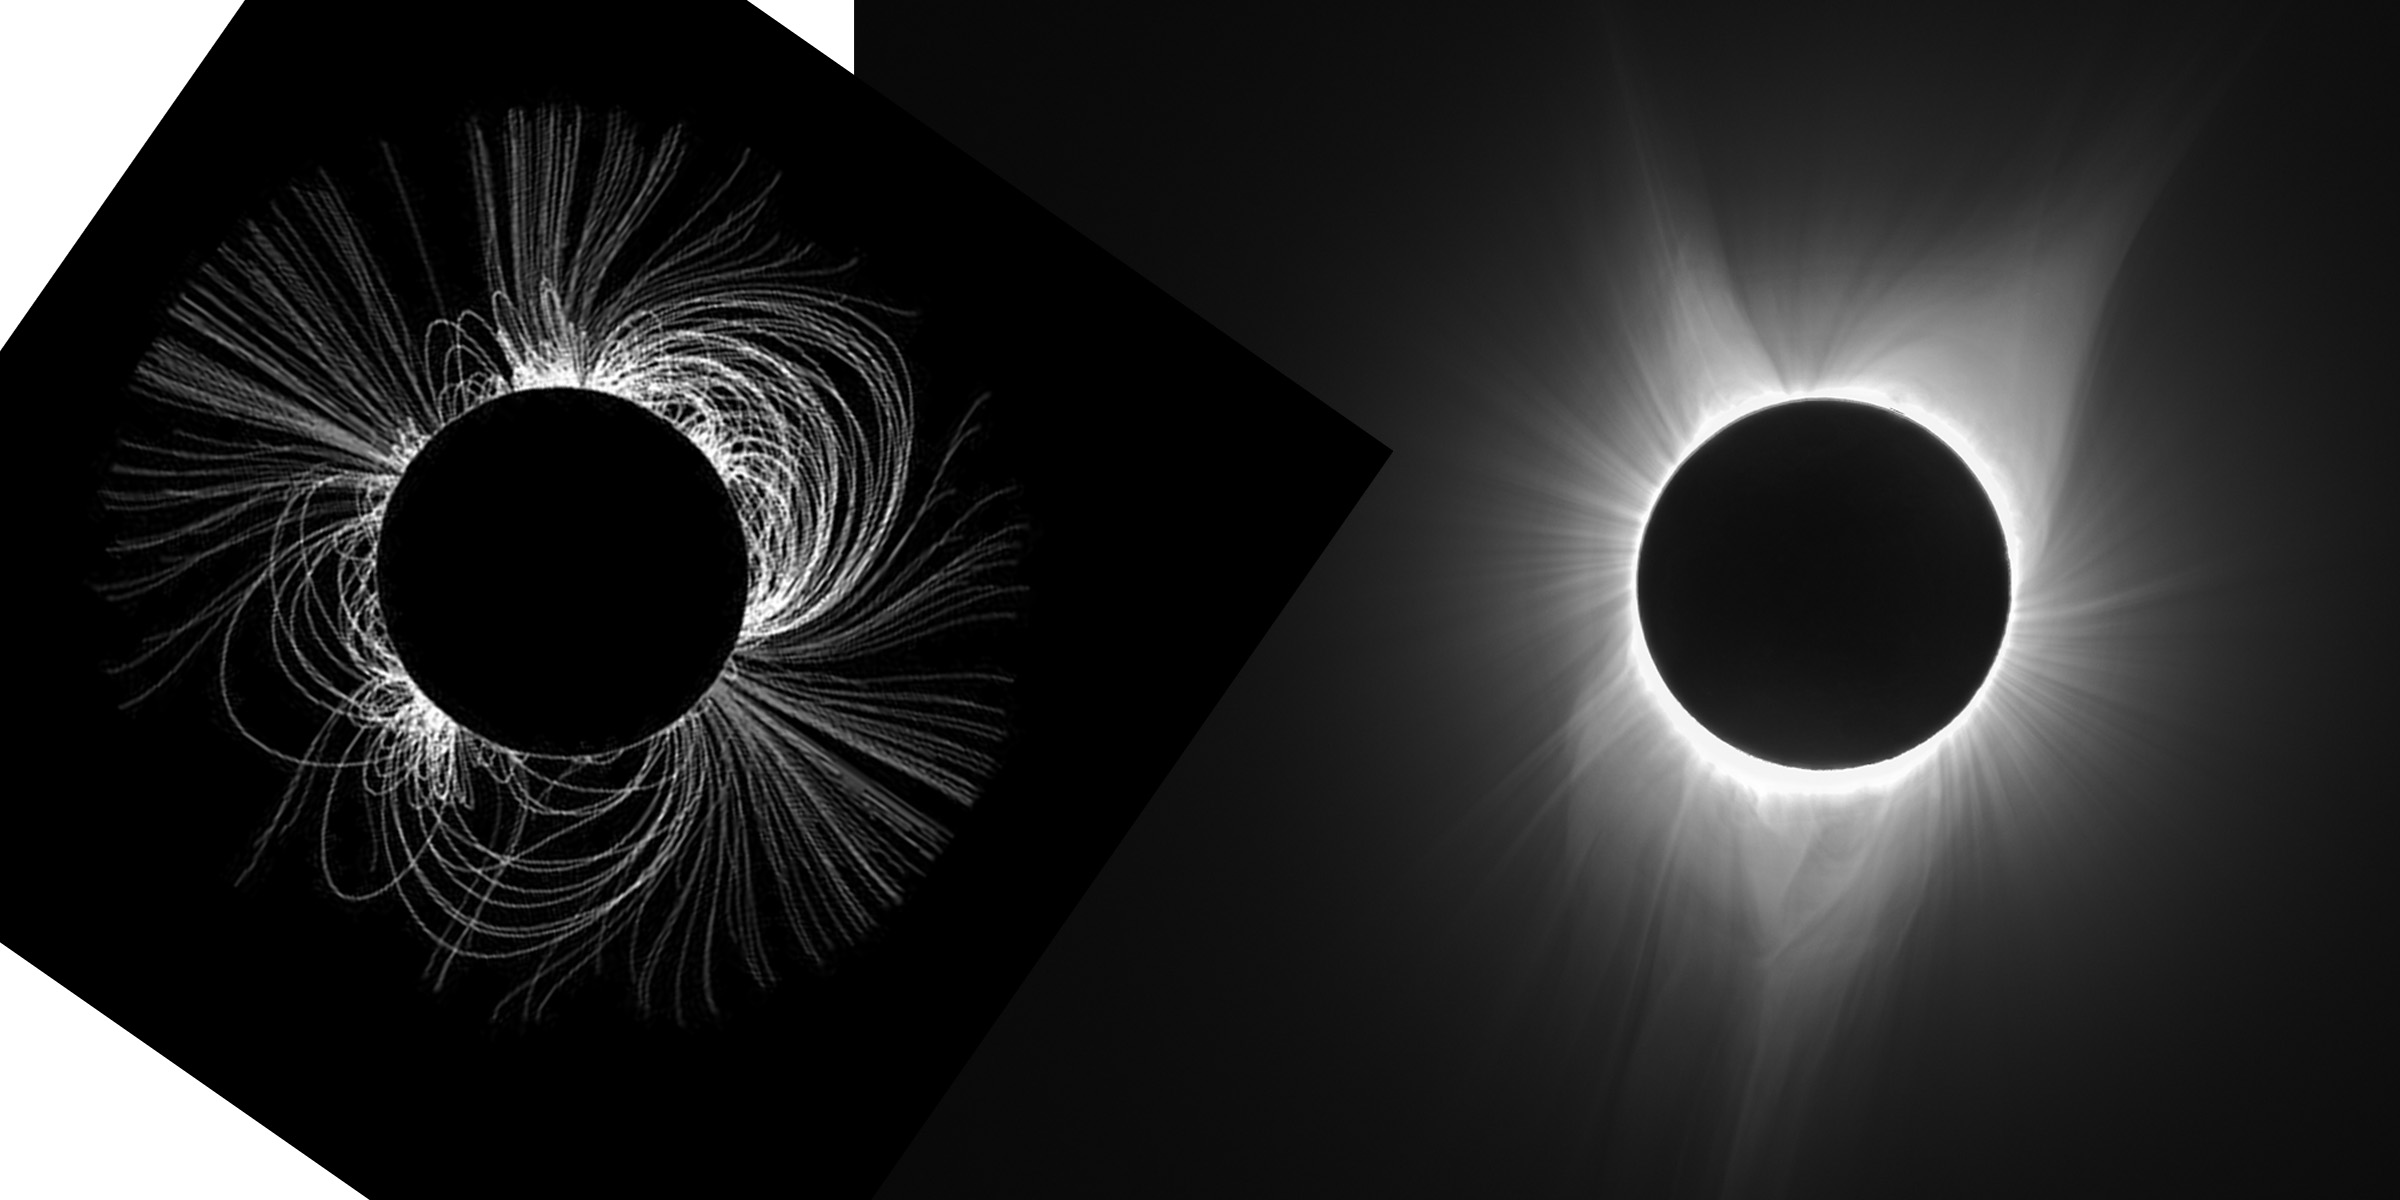
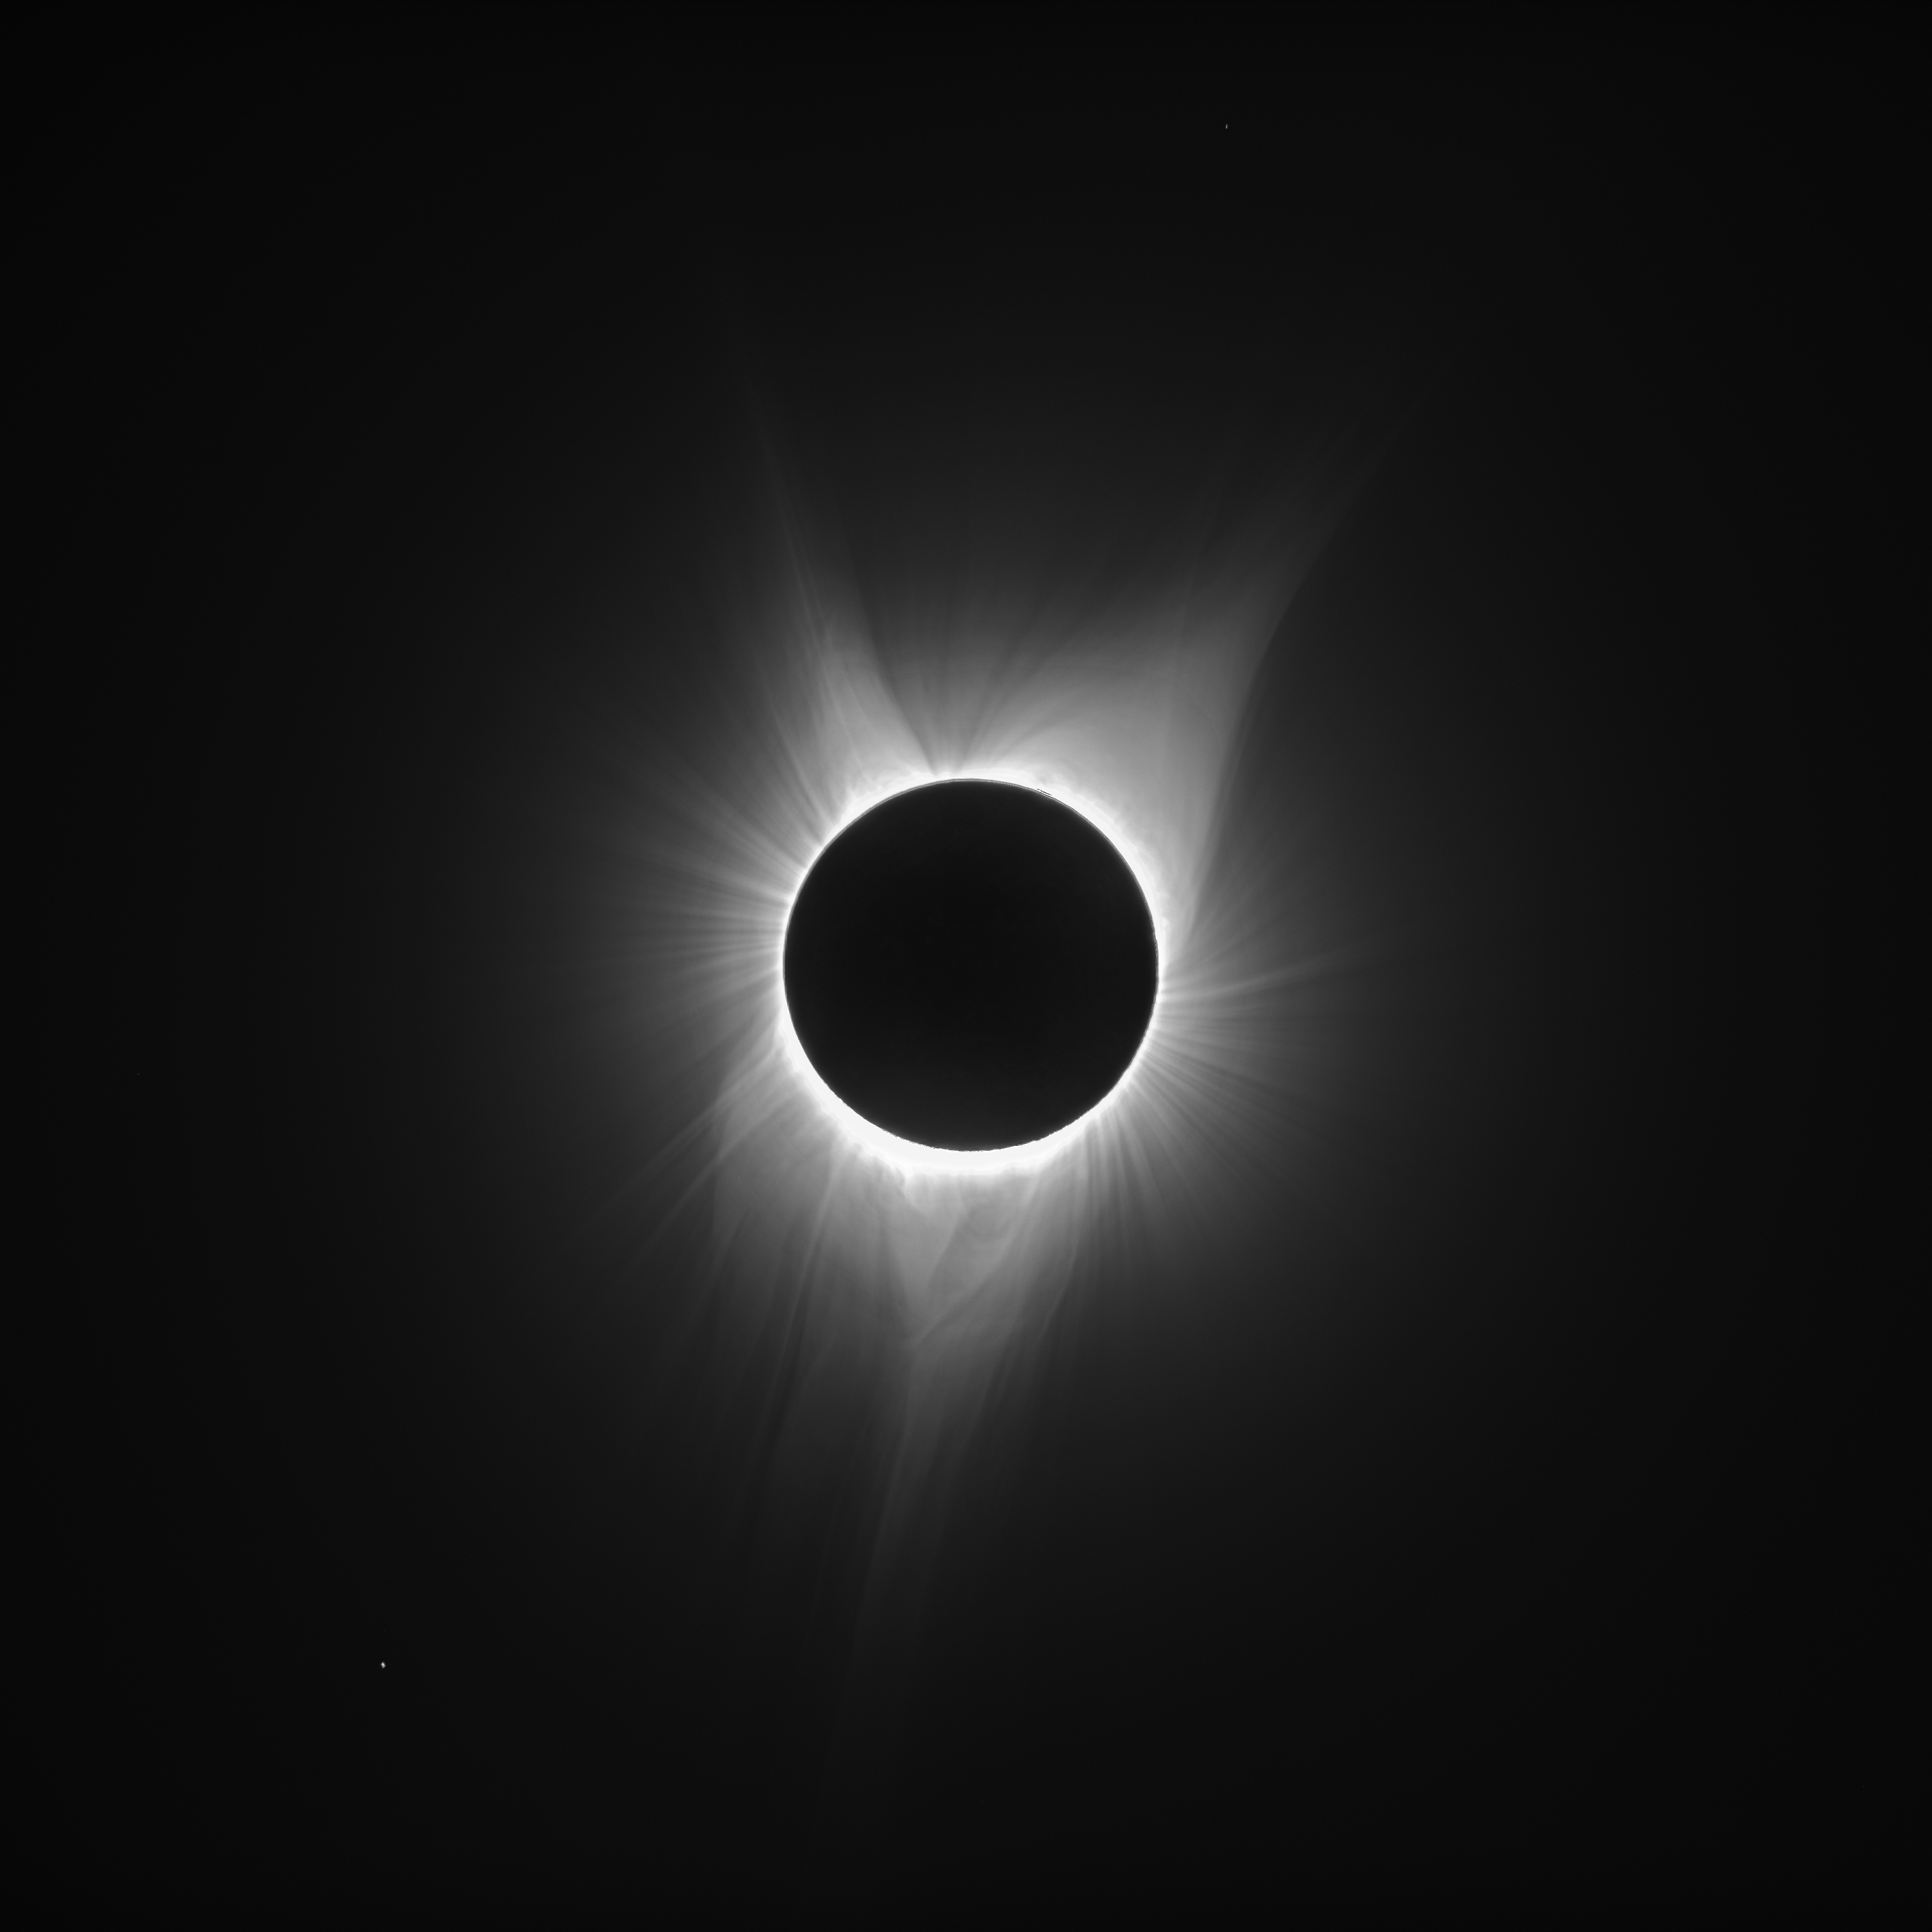
I encountered a report about the predicted corona and wondered how it would compare to what we actually saw.  I do not know the orientation of either the simulation or of my image (where is the solar north pole?).  Are these similar?

Update 20170906:  I still don’t know the absolute orientations of either image, but found that there was a correlation of the field lines that seem to stream directly out from the Sun.  See if this is a visual match:

coronalForecastOverlay.2up

Posted in Eddington Experiment | Leave a comment

Eclipse Day!

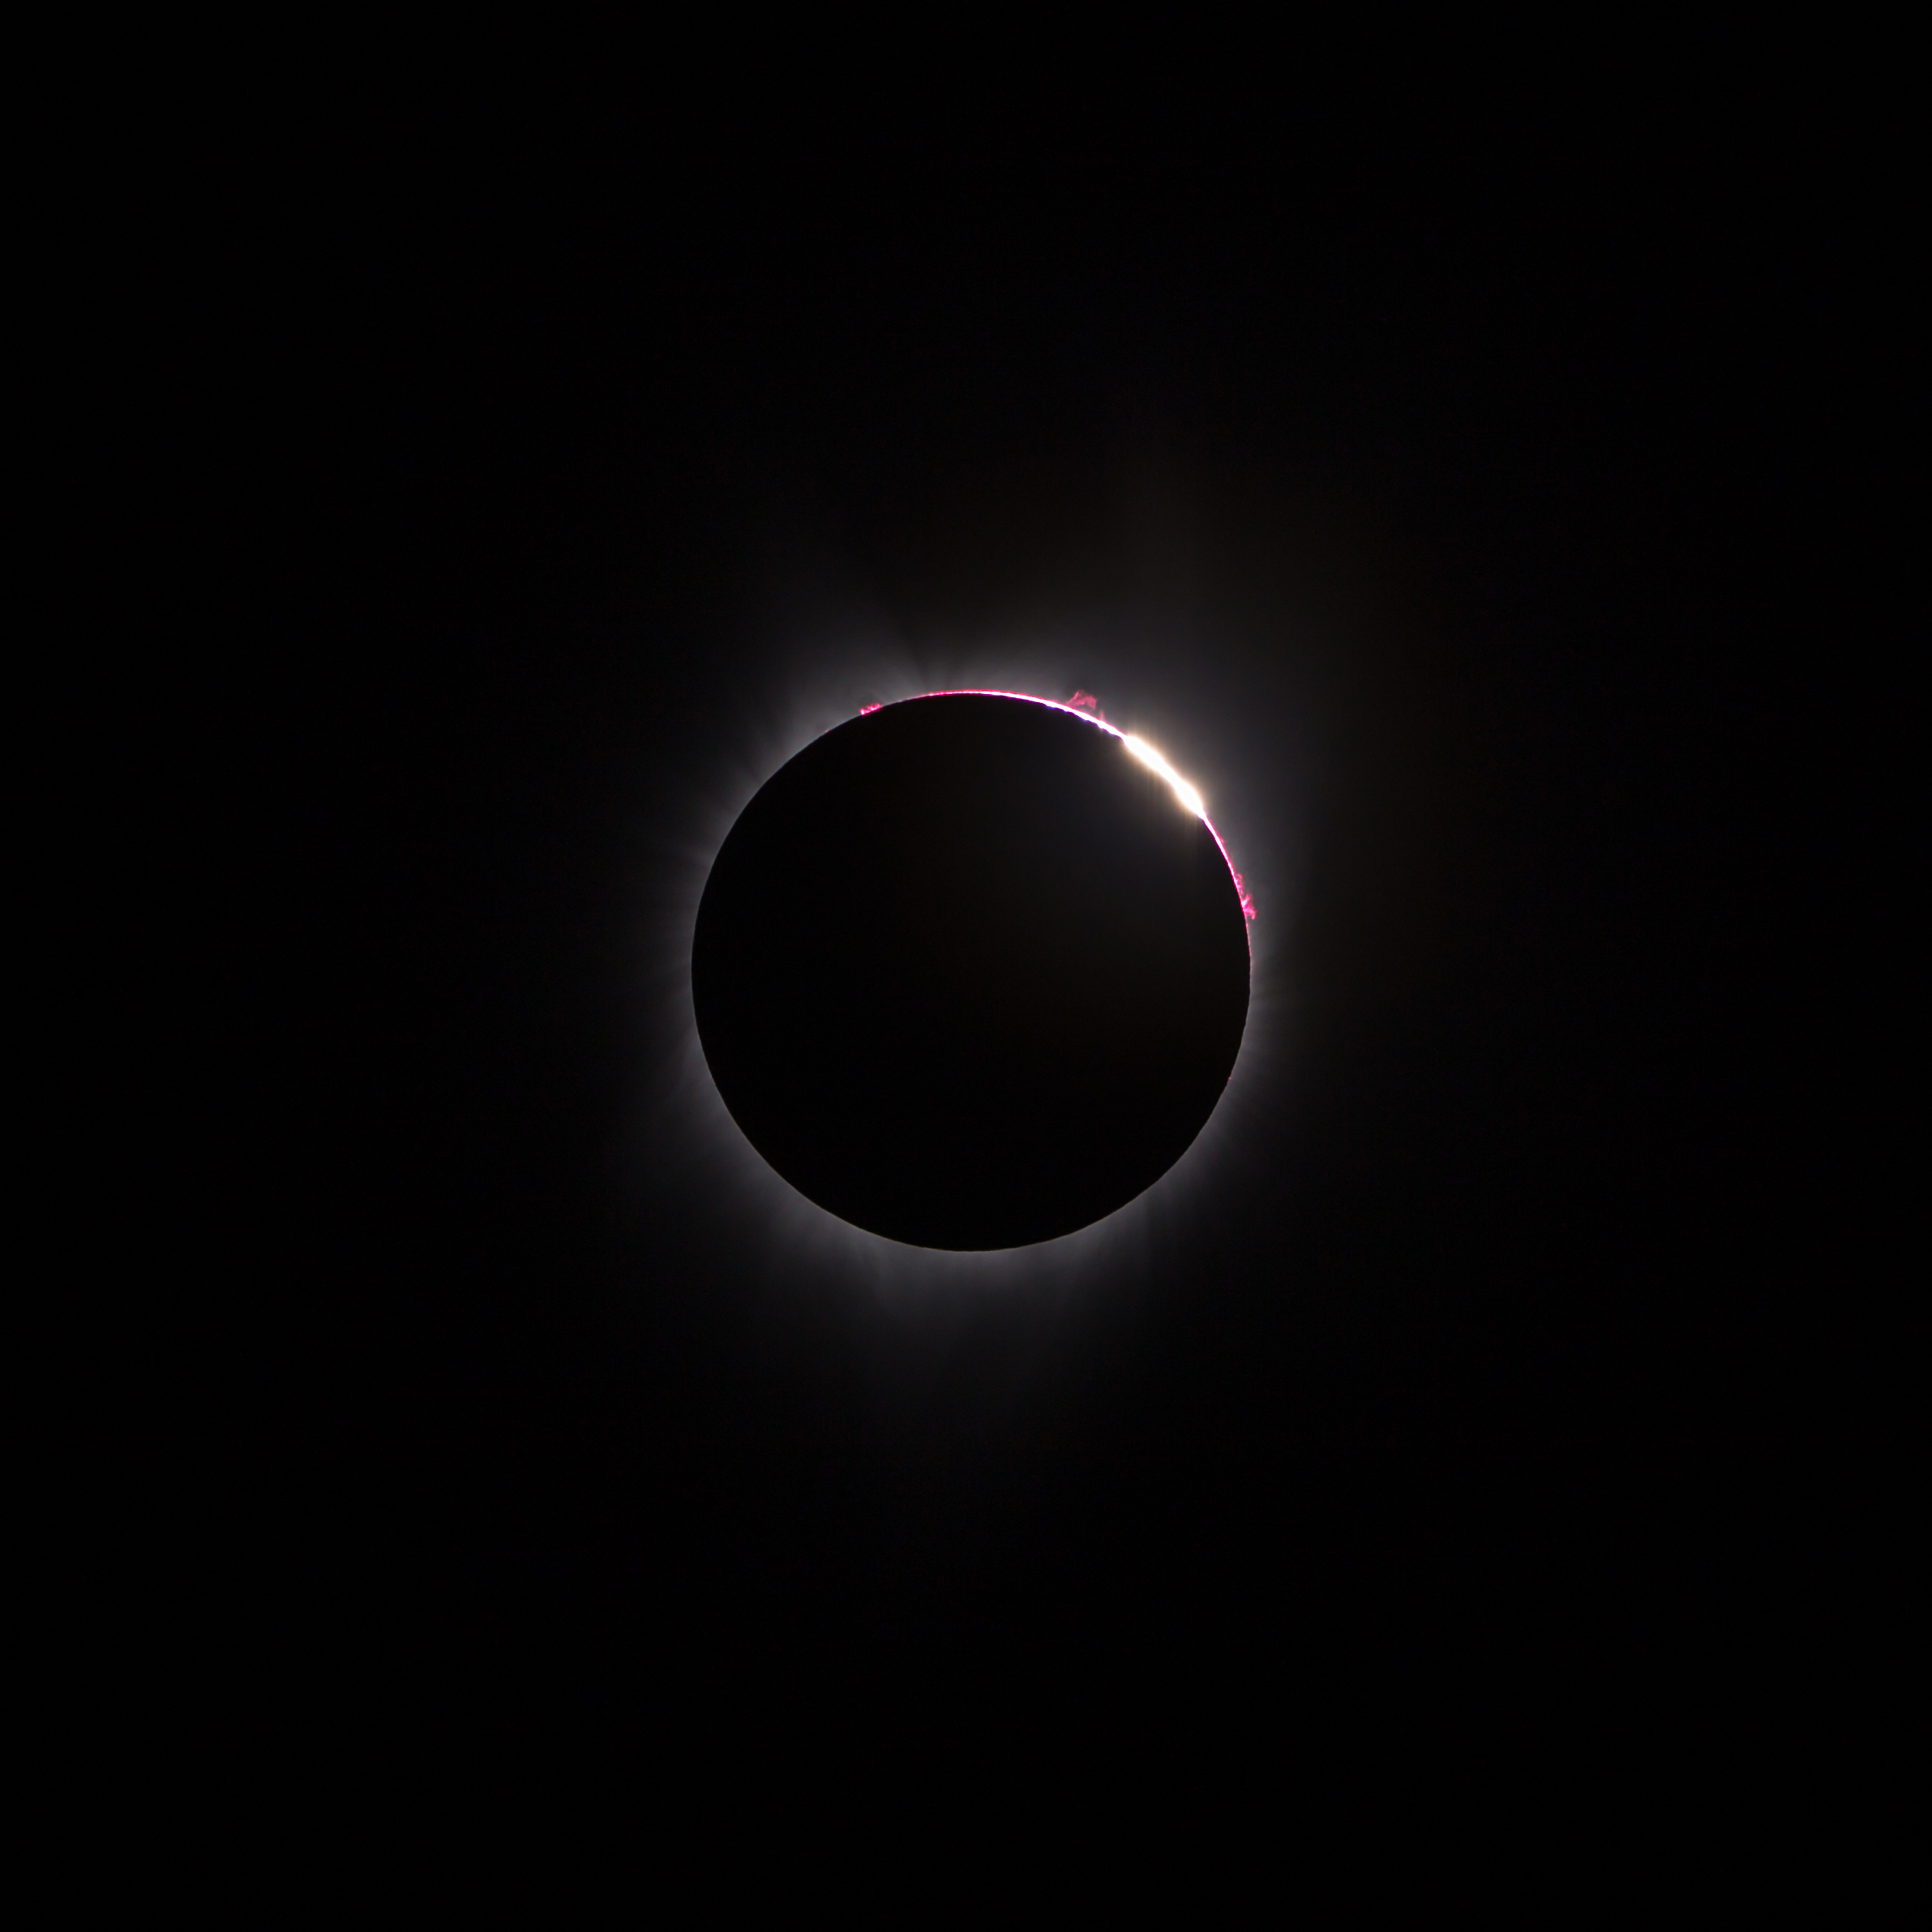
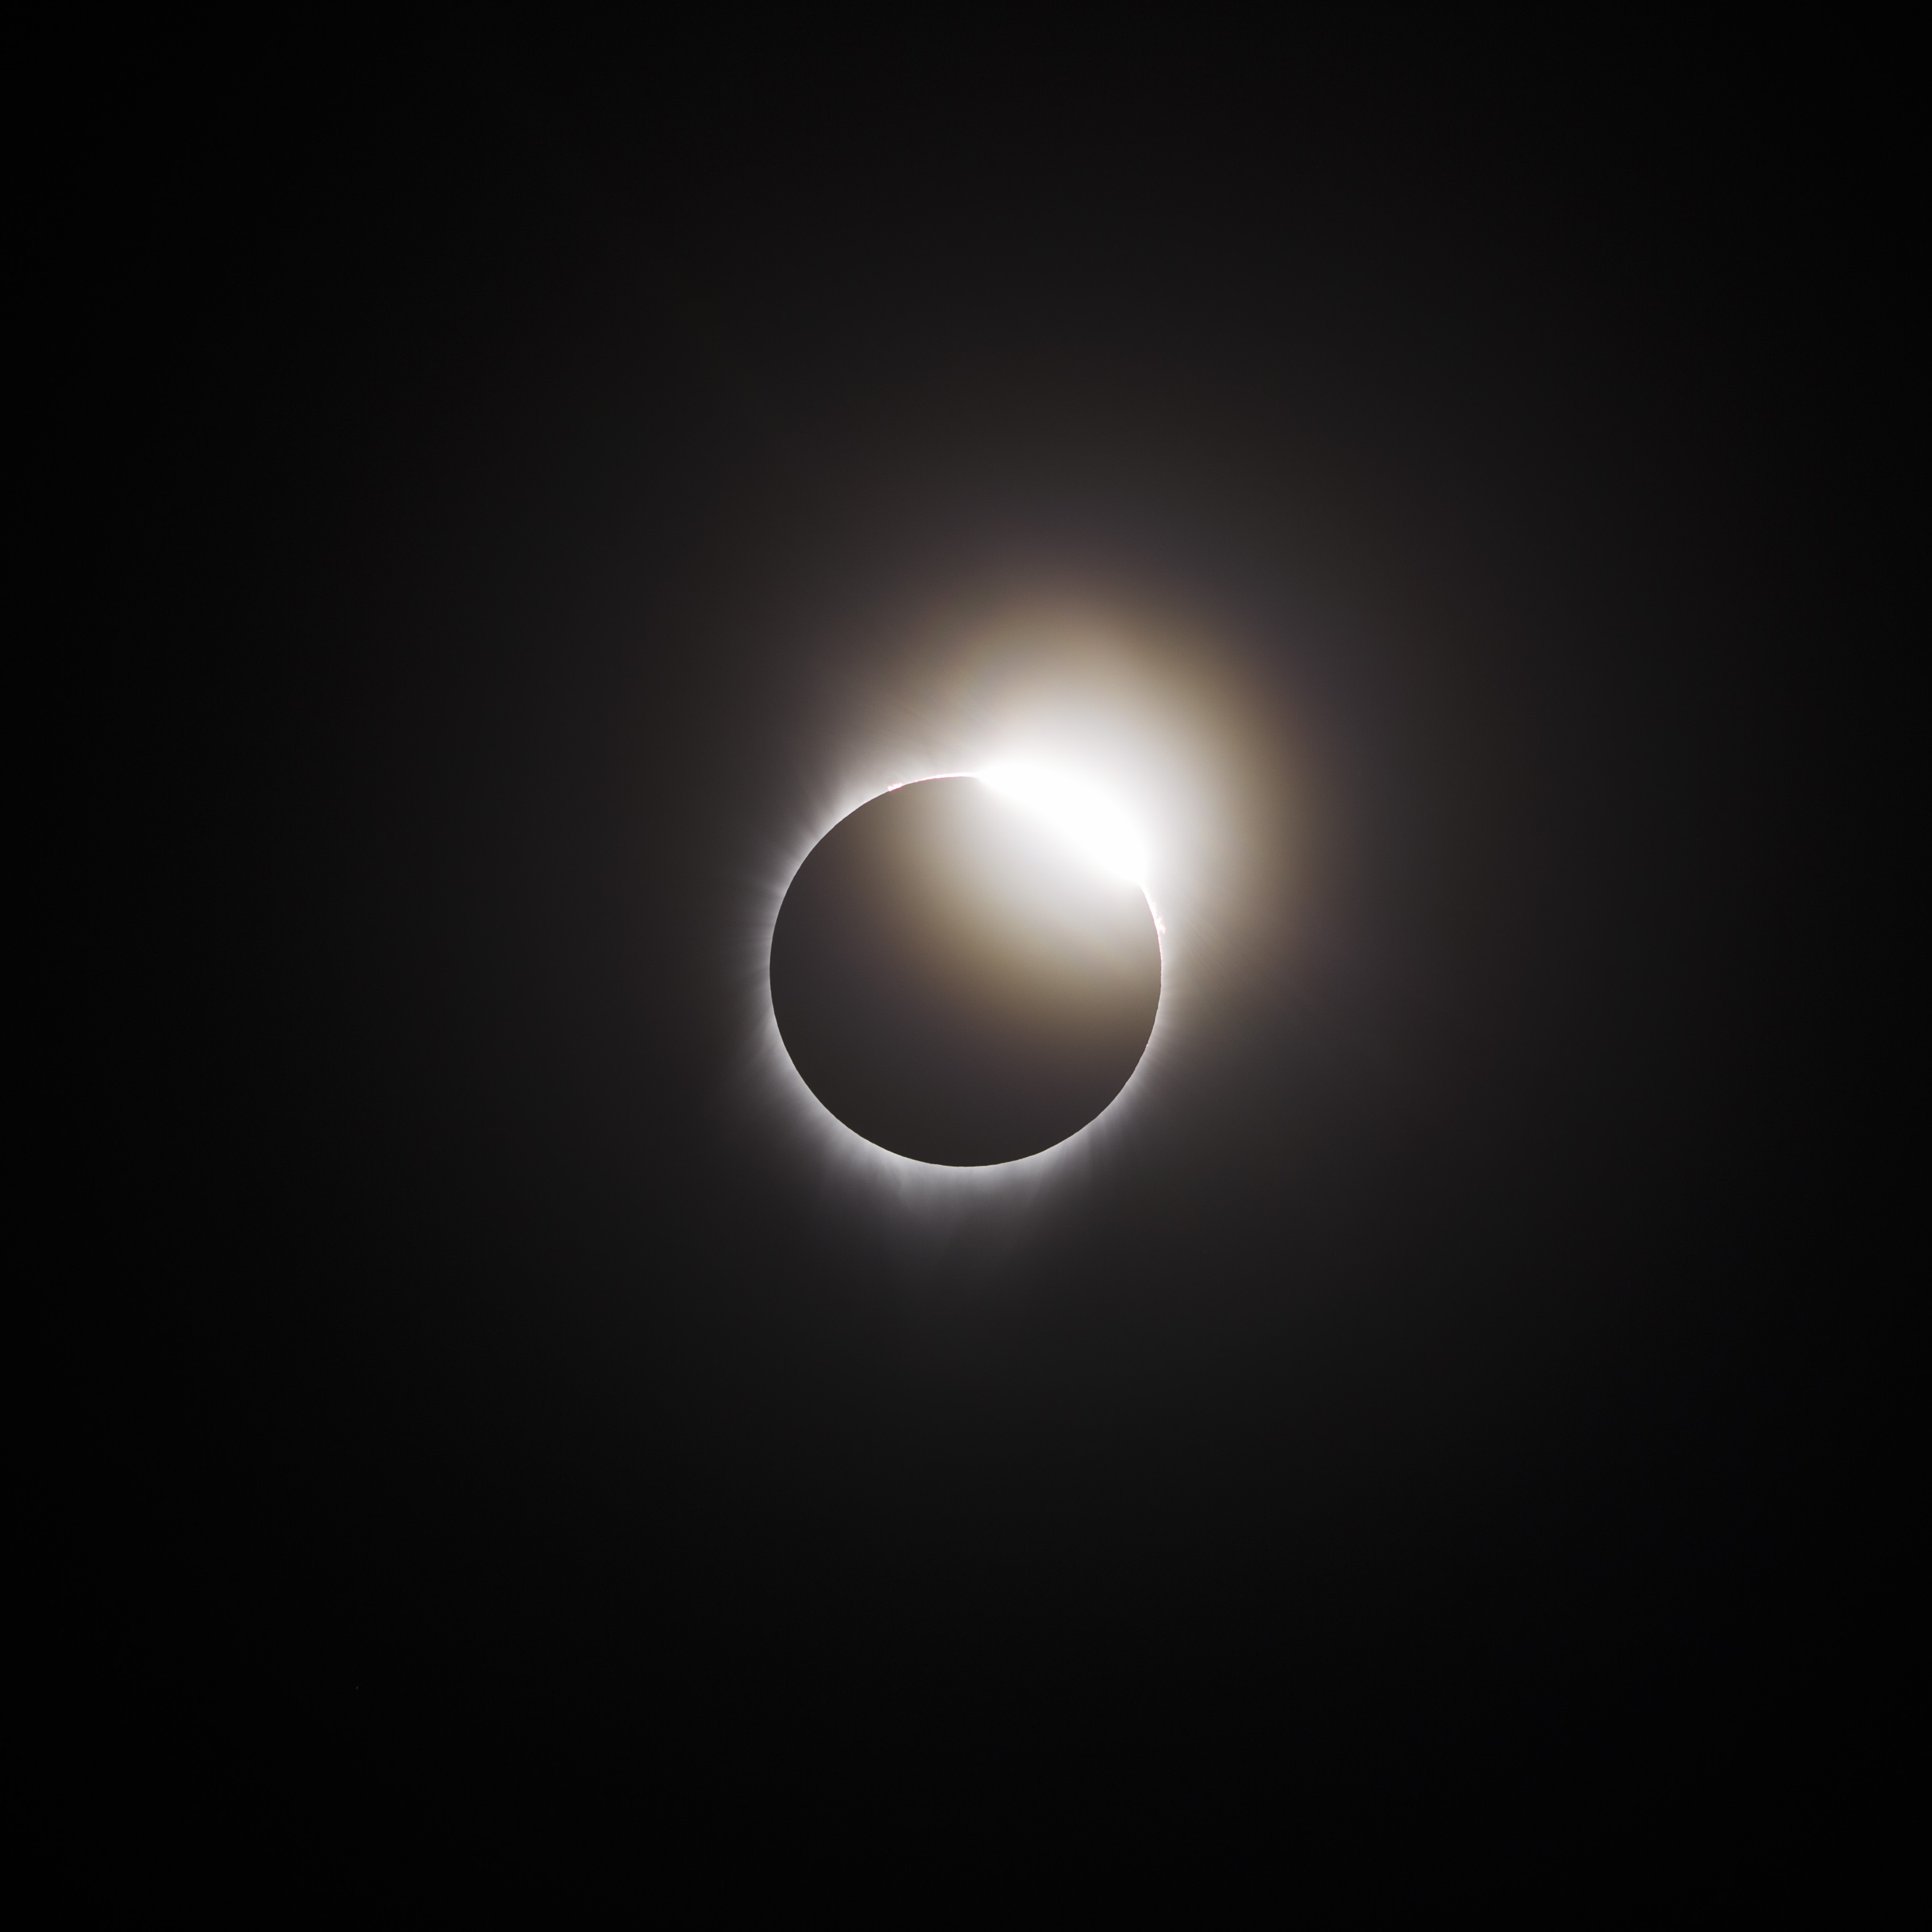
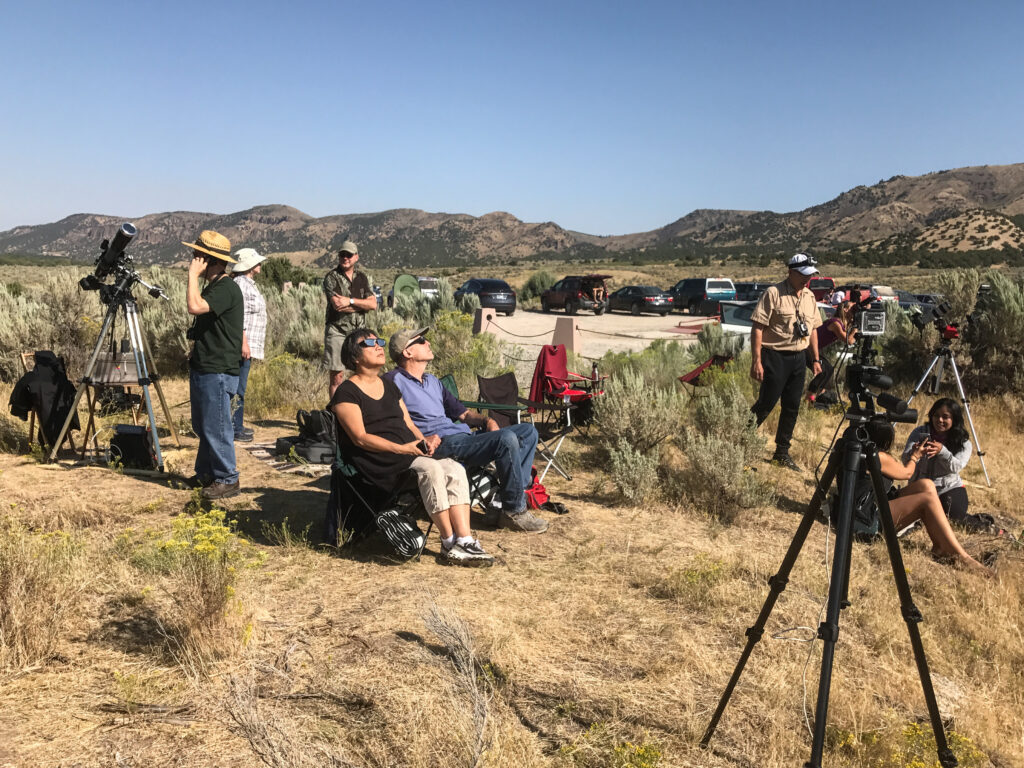
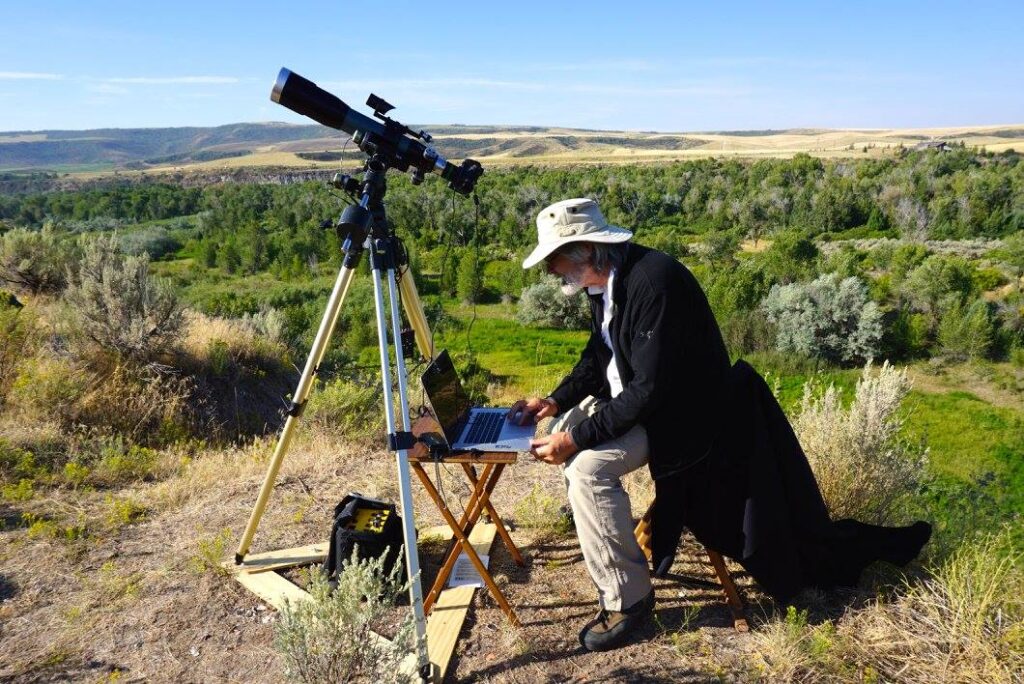
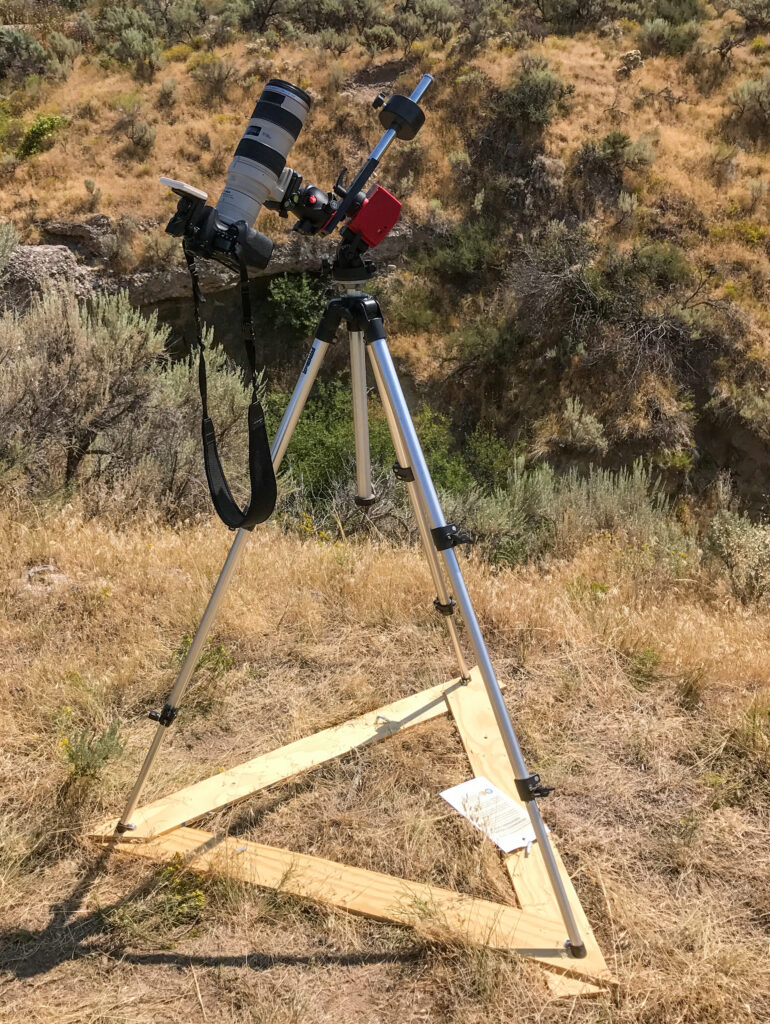
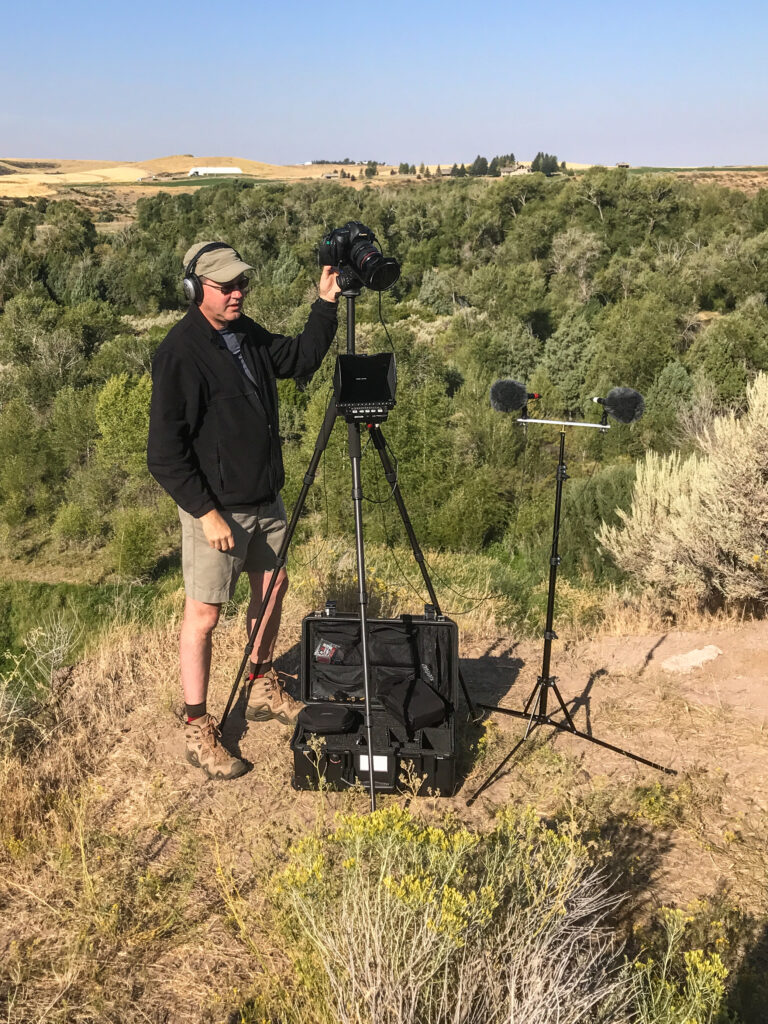
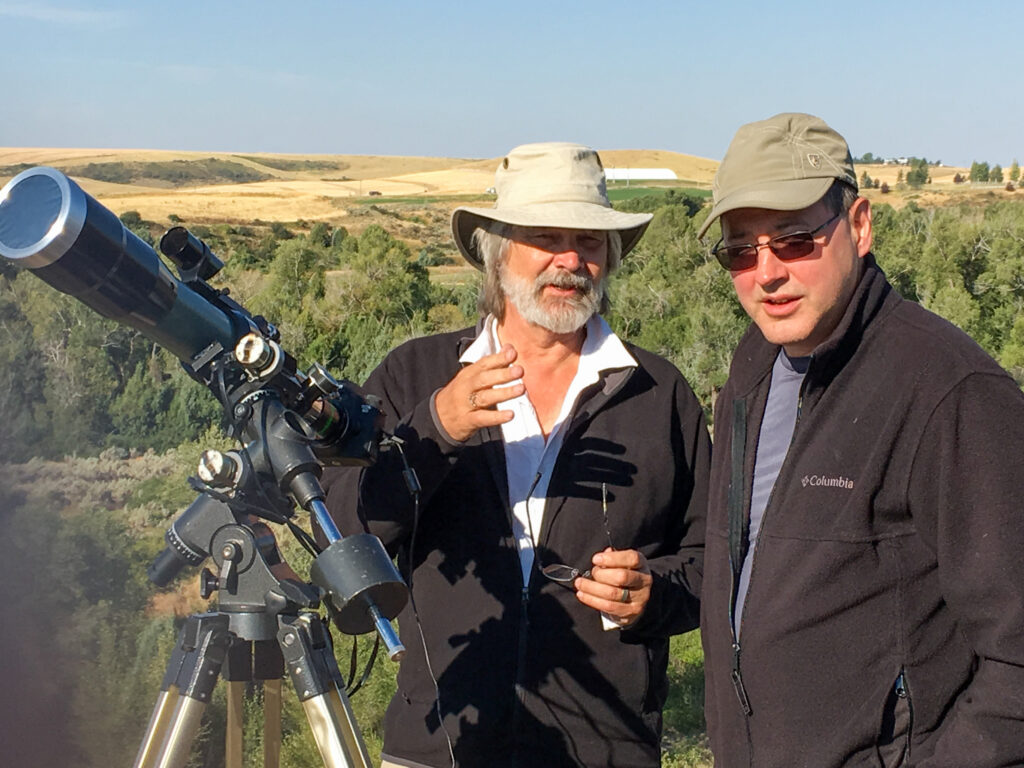
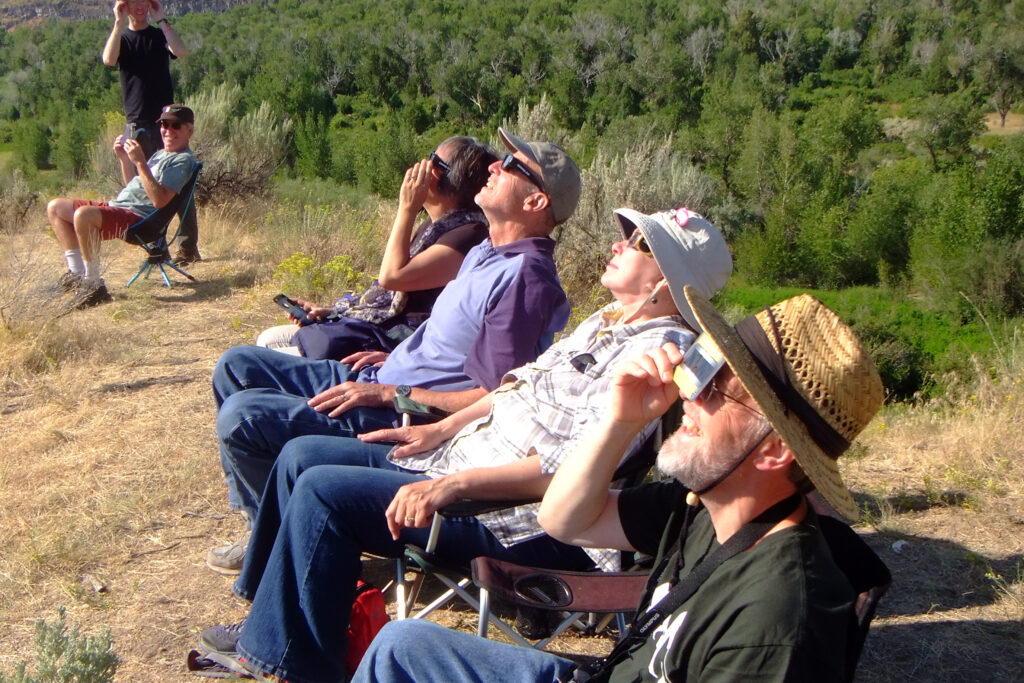
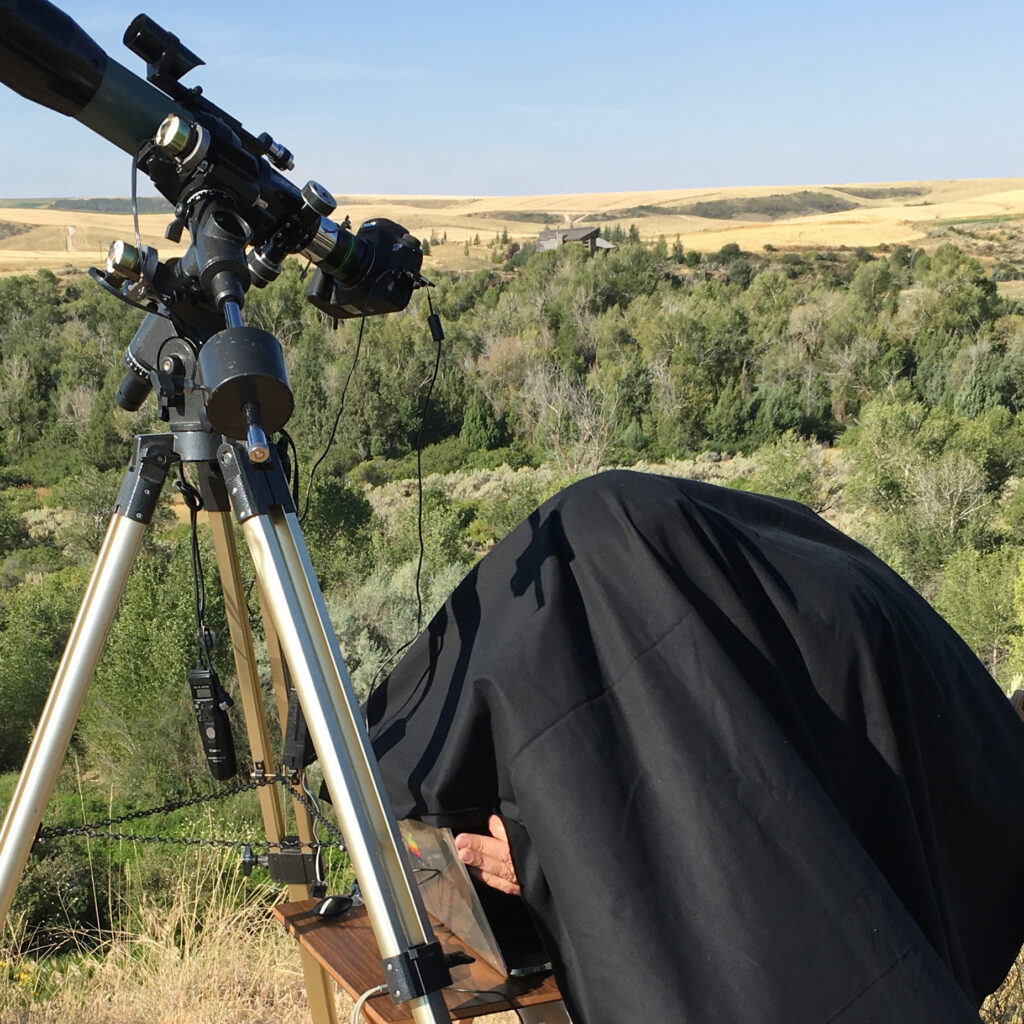
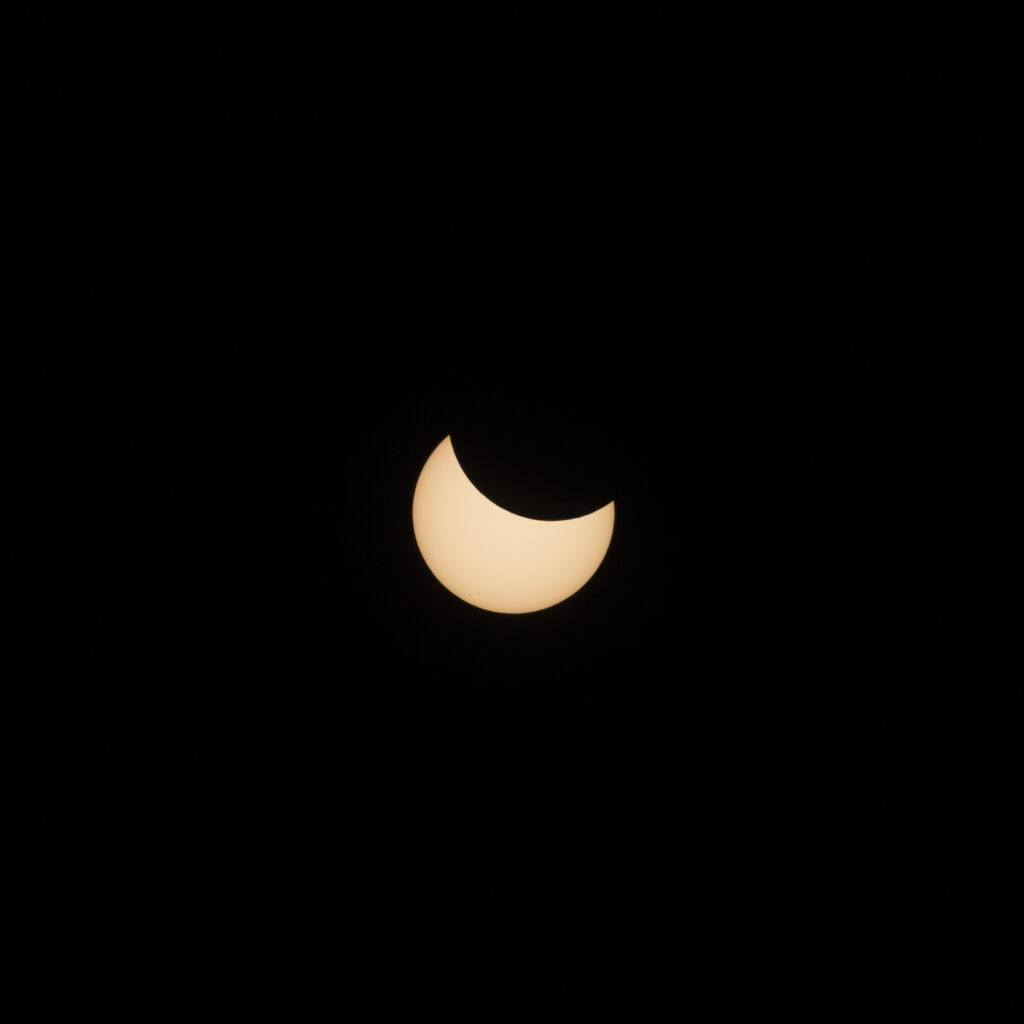
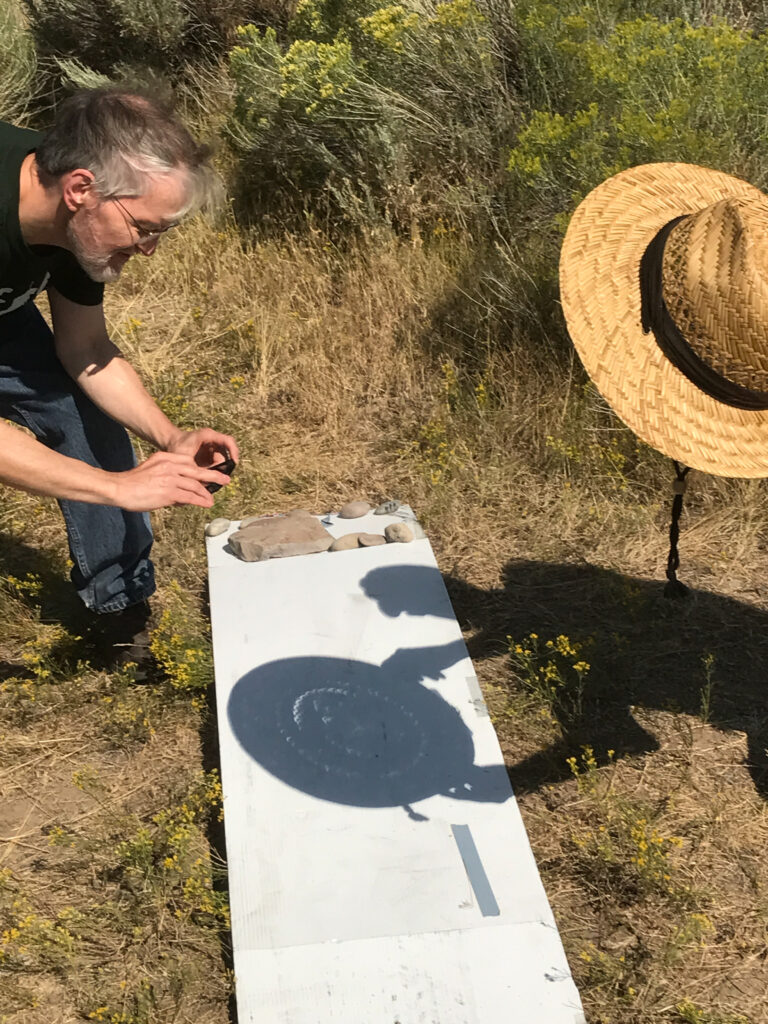
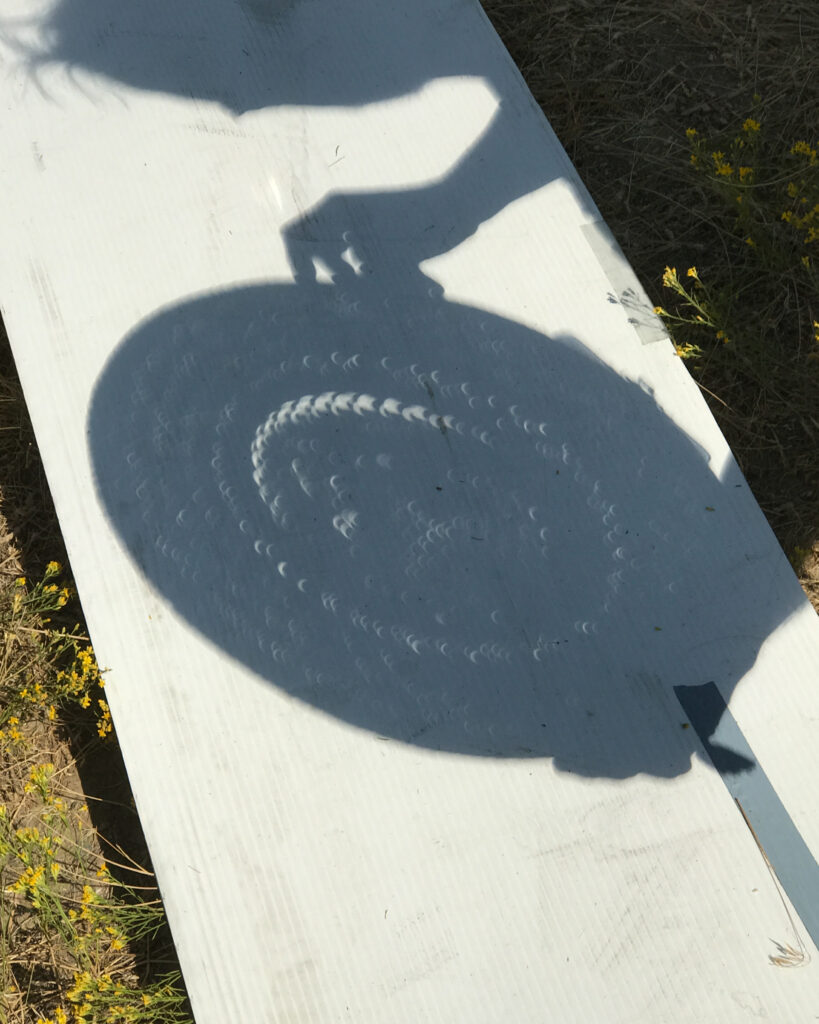
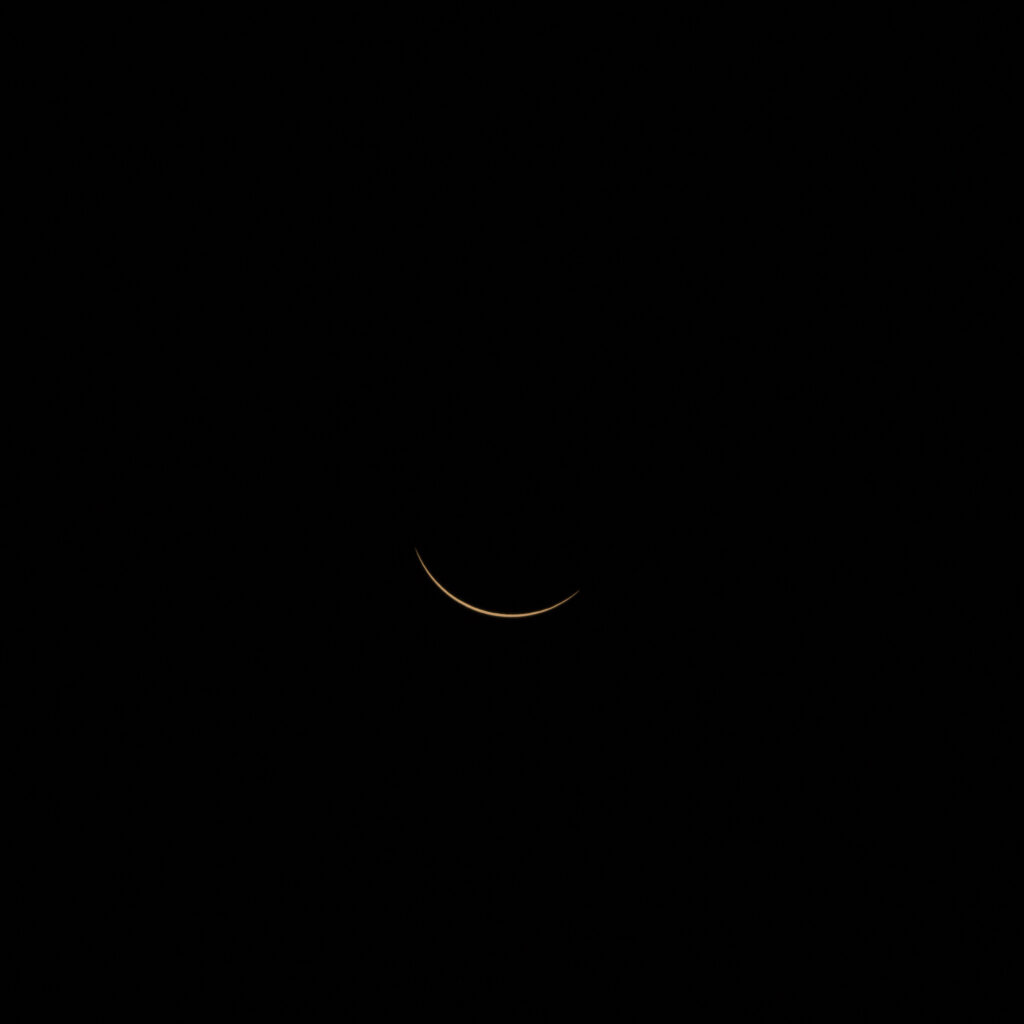
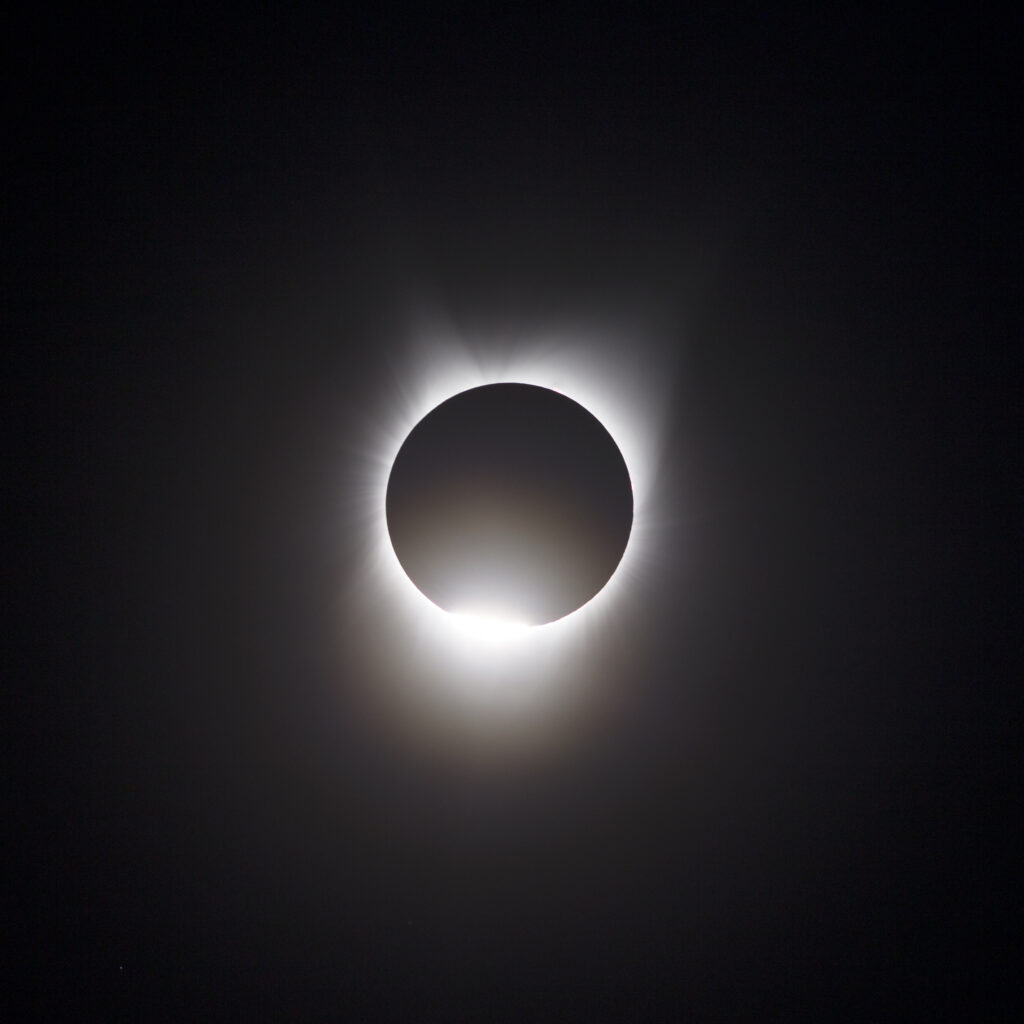
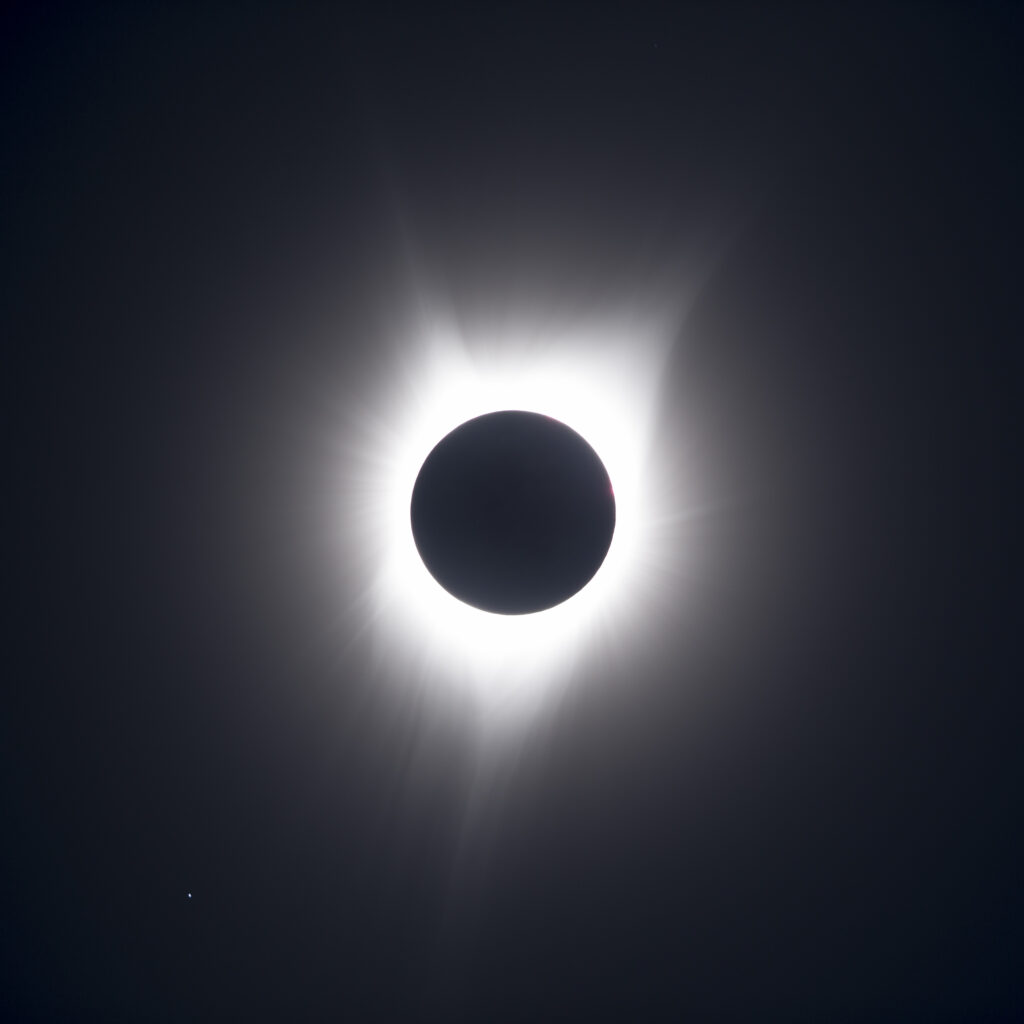
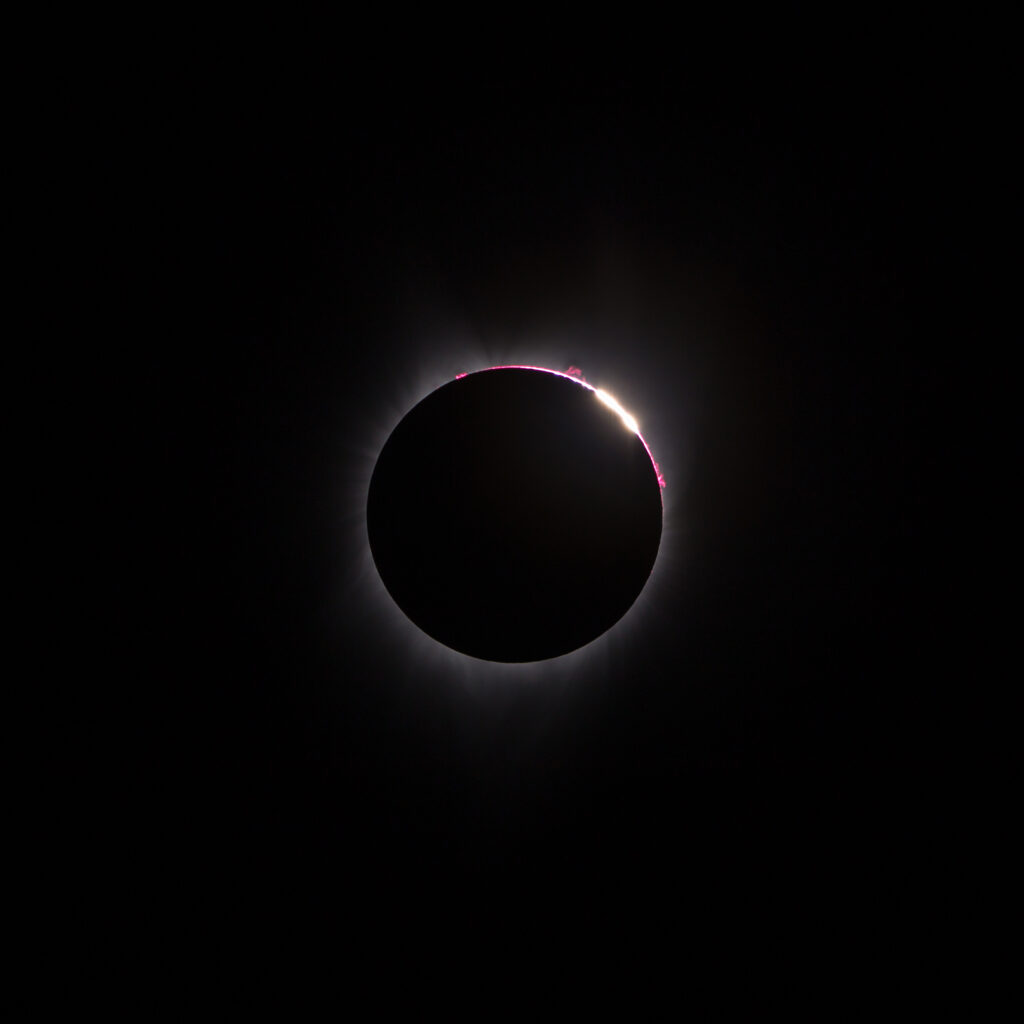
The good weather held and we had zero clouds and negligible smoke for the eclipse.  Temperatures were climbing in the bright morning sun, but stalled and then dropped during the partial phases of the eclipse– enough that we donned our fleece jackets again!  Here are some shots of the event (click to enlarge).

Posted in Eddington Experiment | 2 Comments

Step EE-3: Finding the best fit

We now have a way to transform the stars detected in an image into our virtual camera reference frame, but the previous step was just the “rough alignment” based on two bright stars. This is vulnerable to errors in how those two star positions were identified, especially if they were bright enough to saturate the detector, or were influenced by poor atmospheric seeing conditions.

More importantly, we are attempting to measure a tiny change in radial distance from the center of the sun. If we make a small error in where that center point is, by even a fraction of a pixel, it will affect all of our distance measurements to the stars revealed during the eclipse.

This means that it is less important to align the star positions as it is to get their angles with respect to the sun correct. If the angles are correct, then we can measure the radial distance from the image center and be confidant when we compare the “before” distances to the “during” distances that we are measuring from the same center point and are not being fooled by some offset to the actual center. This is particularly important in the before images. In the during image, we can, in principle, locate the center of the sun (though this too has uncertainties since we are seeing the moving moon’s edge, not the sun’s). The collection of observed stars is an unambiguous pointer to the sun’s position at the moment of maximal eclipse.

To this end, the output of step EE-3 is the small additional offset and rotation that places the observed stars in best angular alignment with known angles of the reference stars. This small adjustment will be applied to all of the detected stars to obtain their final position in the reference image plane. Their radial distance from the sun is then easily computed.

Matlab script radialAlign.m was created to do this task. It takes the results from step EE-2, the rough alignment and transform to the reference frame. The output is a set of star positions—the reference star positions in the reference frame, and the slight deviations from those positions as detected in the image.  In an ideal world, the deviations would be zero in the “before” image, and would show some gravitational deflection in the “during” image.

Posted in Eddington Experiment | Leave a comment

Step EE-2A: A side process to calibrate (radial) lens distortion

radialFitTestErrorsUnexpected errors while looking for the best angular fit between the imaged stars and their reference locations.
 

My early efforts to map the imaged stars onto their virtual camera positions showed unexpected errors. They were close, but displayed error amounts that were inconsistent with a simple scale or rotation mismatch.

It seemed possible that the errors came about because of the radial distortion of the lens, which one reference suggested might be as much as 0.05%, a huge amount for this measurement.

To calibrate, a frame with more stars included (via increasing the ISO) were compared with their target (reference) locations and the radial errors were plotted and a correction curve computed to best fit them.

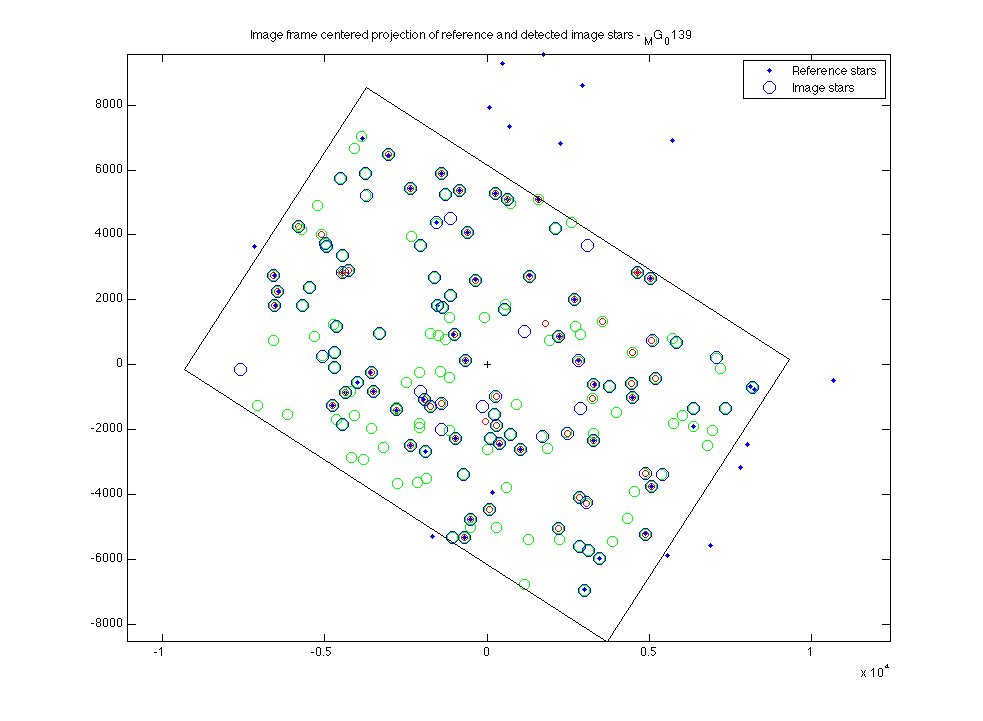
radialCalFig2Reference stars and detected stars. The correlated pairs are used for evaluating radial distortion.
 

There are reference stars that do not have a corresponding star in the image, but there are many more detected stars without a reference coordinate. These may be spurious noise, or faint stars that were not listed in the reference star database (displayed by Stellarium).

radialCalFig7The correlated pairs of reference and detected image stars with an indication of the position discrepancies. Near-center stars are too close, and farther stars are too far.
 

The errors range over +/- 15 arcseconds, a few pixels in the image, but ten times the amount of deflection signal we are trying to detect.

To improve on this, we need to perform the rigid transform that finds the image center and angle that best aligns the detected stars with their reference locations.


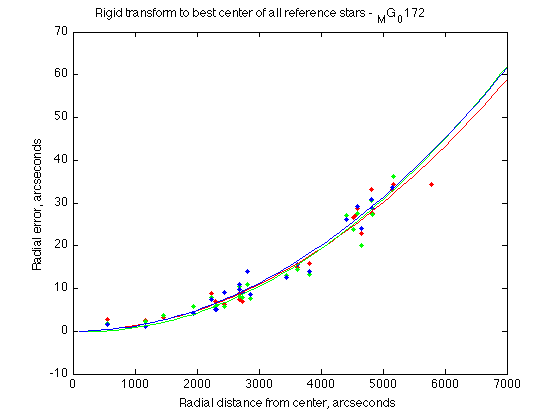
radialCal6The radial errors, plotted as a function of distance from frame center. A polynomial fit is made to approximate them.
 

A radial correction function can then be obtained by finding a polynomial fit to the residual errors. This means that a function with factors of radius: r0, r1, r2, r3 etc. is used to approximate the distortion introduced by the lens. Knowing the distance from the center, we can use it to compute how the lens has shifted the star positions toward or away from the center, and then correct them.

I experimented with several forms of the polynomial function and found that the best behaved was among the simplest. It did NOT include an offset term (r0), and the linear term (r1, equivalent to magnification), was minimized by adjusting the overall base image magnification (arcseconds per pixel). This results in the linear term representing the slight differences in magnification between red, green and blue channels, something that apochromatic lenses strive to match but cannot be perfect at. The remaining error was well represented by the r2 term.

Here are the results averaged from multiple image frames of the eclipse target area:

Camera base magnification to reference frame (arcseconds per pixel):
scale = 2.8443;     % average of EOS 6D calibration frames taken 20170601

This value is used in imagePos.m (step EE-2) as the scale factor to bring star positions into the reference frame where one increment (pixel) equals one arcsecond.

Linear (r1) coefficients (x10-3):
R            0.7731
            G            0.5185
            B            1.0245

Squared (r2) coefficients (x10-3)
R            1.1969
            G            1.2564
            B            1.1745

The linear coefficients are the differential magnifications between the red, green, and blue channels of the image. Green has a small (1/2 arcsecond per thousand) magnification difference from the base magnification. Red is a little higher, and the blue correction is about twice that of the green channel. The image would show a star’s image as having a green fringe toward the image center and a blue fringe at the outside. This captures the general chromatic aberration of the Televue-85 telescope I am using. It is a highly corrected lens that offers beautiful visual views; only a high resolution camera can quantify its color mismatch.

The squared coefficients indicate a general behavior of lenses and how ideal they are in projecting their field of view onto the perfect geometric projection we are using as our reference frame. These corrections are also quite small, but over enough radial distance contribute a position error that builds up to many arcseconds.

The lens correction coefficients (the linear and squared terms just described) are applied in step 3, radialAlign.m which provides the final set of detected star positions which have been angularly centered, and radial lens corrected. There are still some errors from the reference positions, but they are much reduced.

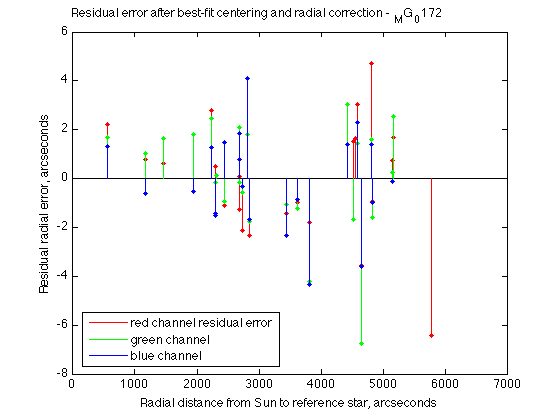
The remaining errors, plotted against radial distance from the center are limited to around +/- 5 arcseconds, and do not show any significant trend. If they did, we could identify it and apply additional corrections to remove it.


radialCal9

The residual errors after using the polynomial correction.


The radial correction brings the RMS errors to within 2 arcseconds (red) to 4 arcsec (blue). I’m not sure what the source of this residual error is, but it is of the same magnitude as typical Minnesota astronomical seeing. It may just be the twinkling motion of the stars. We could check this by comparing two separate exposures to see if the errors are correlated. If they are, then it is NOT due to atmospheric turbulence. If they are uncorrelated, then we need to find some way to overcome this variation, because it is larger than the signal we are looking for.


Posted in Eddington Experiment | Leave a comment

Step EE-2: Transform to reference coordinates

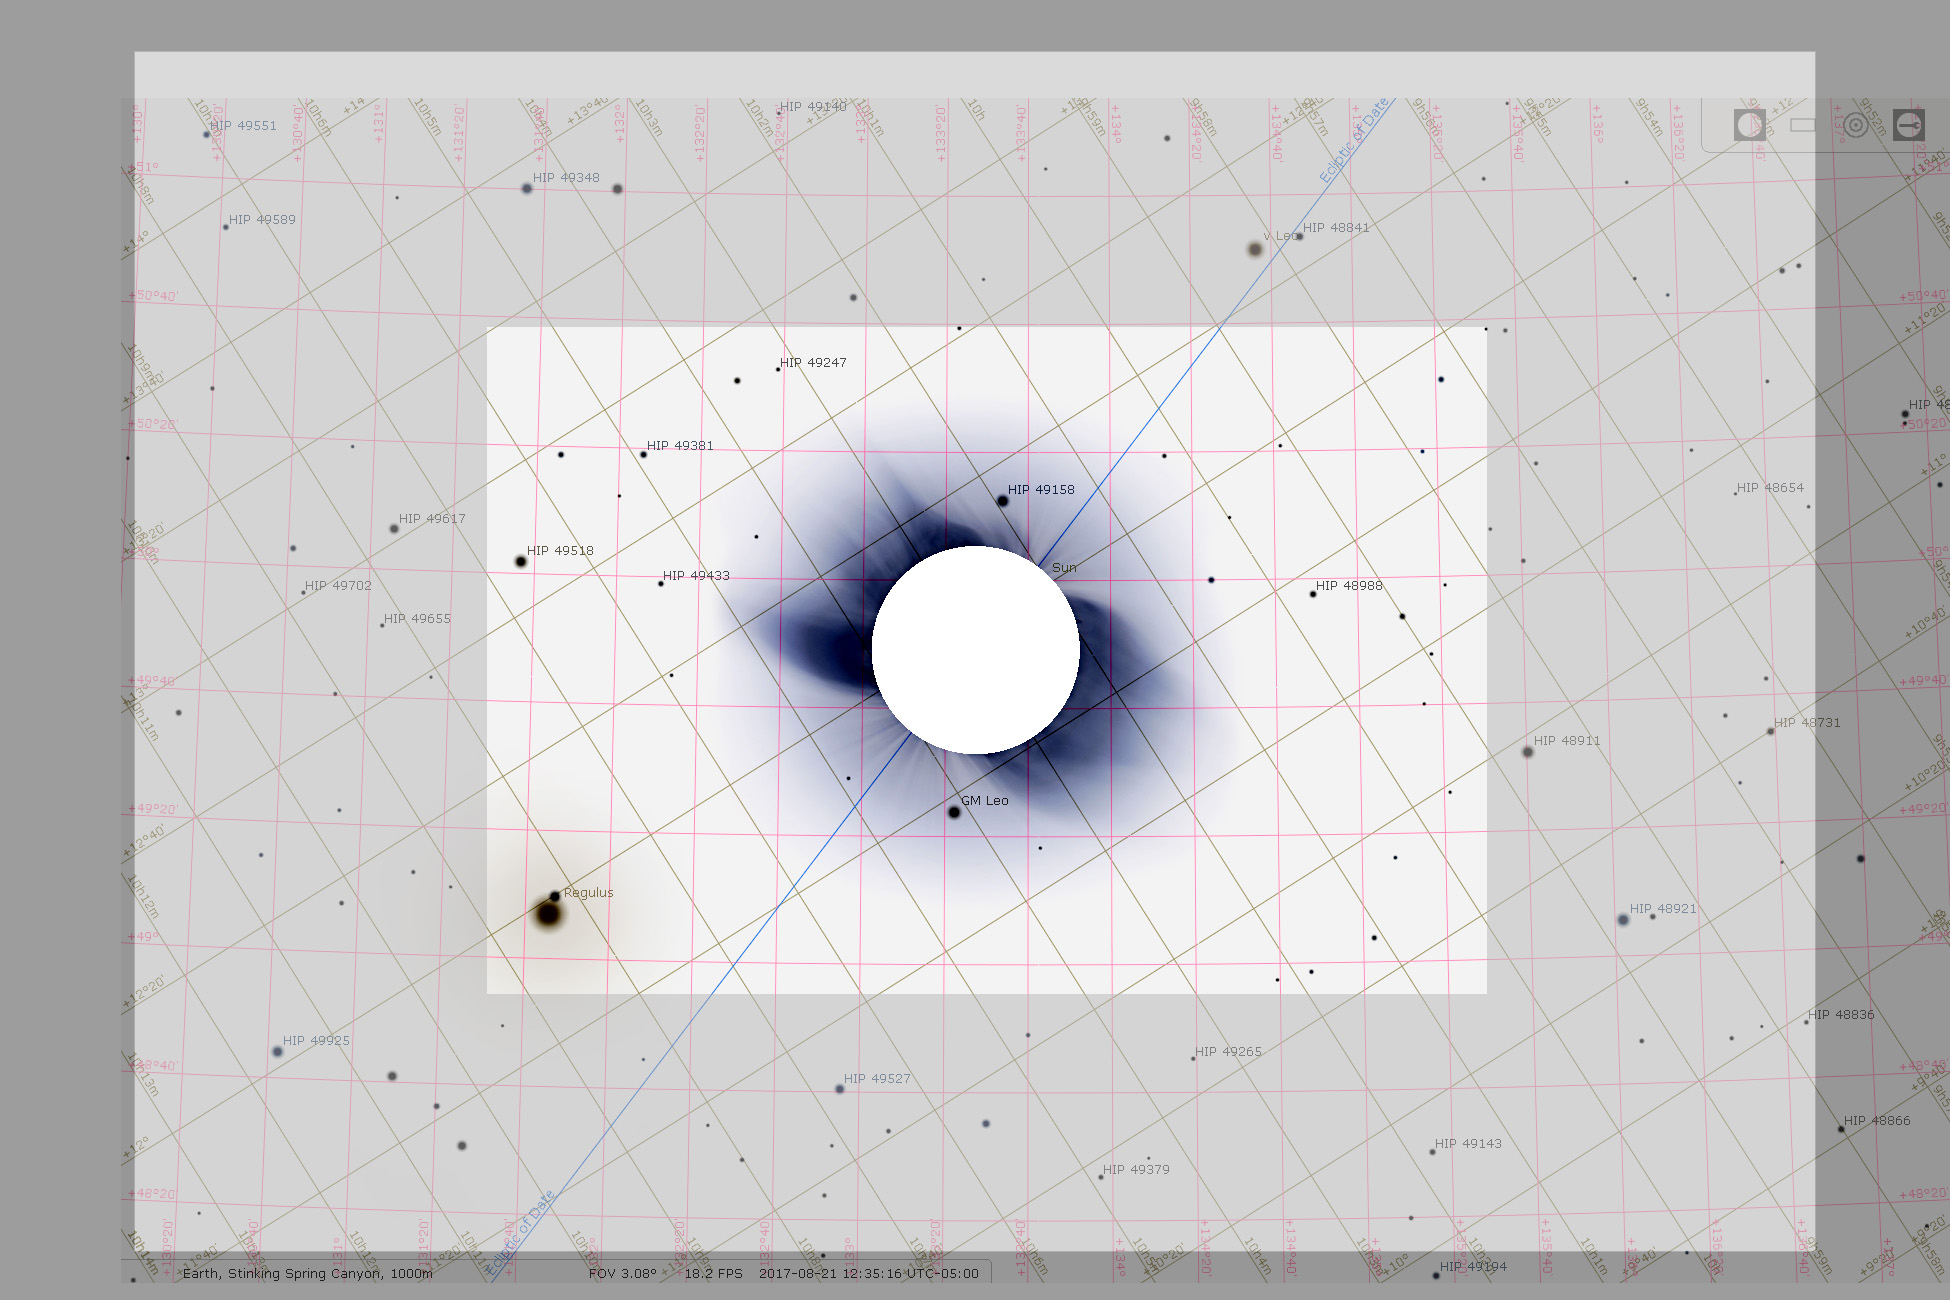
Stellarium.20170821.totalityThe field of view for my EOS60Da APSC sensor (inner rectangle) and the EOS6D full-frame sensor (middle rectangle). The map overlay is the view from Idaho Falls on the day of the eclipse as displayed by Stellarium (and inverted to negative view).
 

Once we know where things are on the image, we need to correlate them to their celestial locations (right ascension and declination, or their equivalent). To do this, we need two landmarks in the image, one for position, and the other for rotation. We will position the image so the first landmark aligns with its celestial coordinate, and then rotate the image until the second matches up. This will provide a “rough alignment” so that the next step (point set registration) will have a good starting point for matching all of the stars in the field of view.

The reference coordinate system could, in principle, be any particular view of the sky. Using the pixel coordinates of the “before” image is a reasonable choice (as would be the “during” image). This would have the advantage of not needing to transform that image at all; it is already in the reference system — only the ‘during” image would need to be converted.

But to keep the mapping easy to think about, and utilize multiple before pictures, I chose the reference coordinate system to be that of a camera, aimed at the sun’s center, and oriented to “up” at the location where I will be taking the “during” photos (near Idaho Falls, ID).

To perform this transformation from image coordinates, we need the projected celestial coordinates of our landmark stars. One star that will be certain to be bright enough to record is Regulus, “the heart of the lion”, alpha-Leo, the brightest star in the constellation Leo, in which the sun will be residing in this eclipse (hence the astrological sign of those born during most of August, including me).

For the second landmark, the next brightest star in the field is nu-Leo, considerably dimmer. Its visual brightness is magnitude 5, compared to Regulus at 1.3, roughly 30 times dimmer.

To gain a sense of star positions, it is helpful to use a use a sky map simulator. I discovered a (free) open source program that does a very nice job of simulating the view of the night sky and allowing me to make maps of the area I am exploring. It is Stellarium (http://www.stellarium.org), and I have been able to identify and locate the candidate stars that will be near the sun during the eclipse.

Using Stellarium, I can identify the reference locations for my landmark stars:

Regulus:             RA 10h 8m 22.01s, Dec 11o 58’ 2.9”
Nu-Leo:            RA 9h 58m 13.35s, Dec 12o 26’ 41.1”

These are the brightest, but there are a few others that may be useful in case one or both of these are not in the image.

I need to map these angles onto the image plane of the virtual camera in Idaho that is aimed at the sun. This is a basic calculation in computer graphics, a field that I accidentally have some experience in.

Now that we have a reference frame established, we need to transform our before and during images into it. This too is a standard operation in computer graphics. All that is needed is the transformation matrix, a set of six numbers. Given two reference star locations, the six numbers can be calculated and applied to all the other stars in the image to find out where they land in the reference frame.

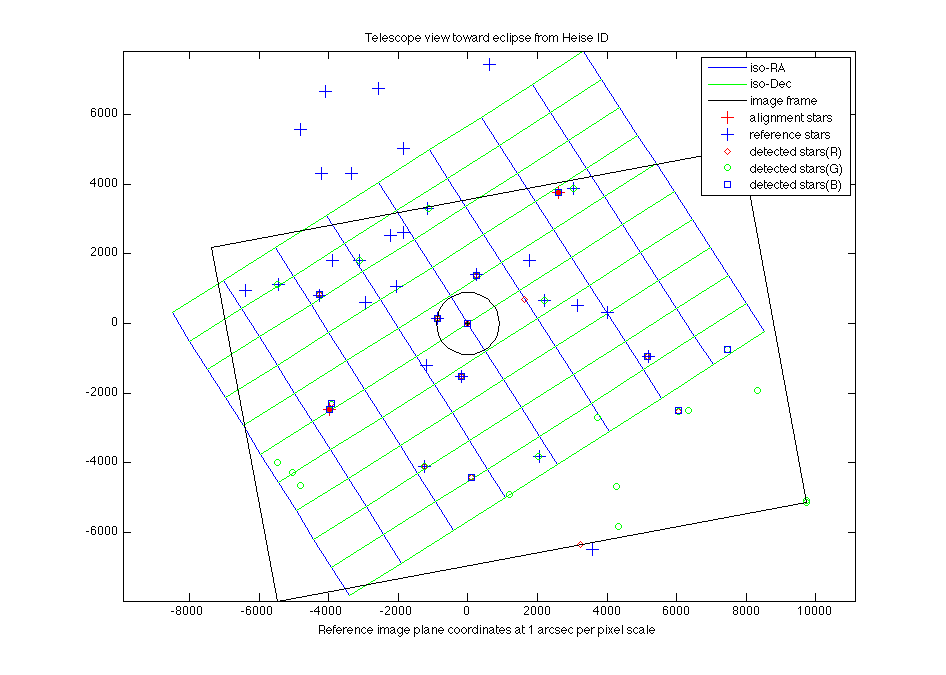
The virtual camera can have any number of pixels we wish. I decided that it would be convenient if one pixel represented one arc-second in the sky.  The image frame from this virtual camera looks like this; the reference stars are plotted, and the alignment stars are marked. The stars detected from a one-second exposure of this part of the sky have been mapped into this reference frame.

imageViewHeiseA test “before” image transformed to the reference virtual camera view at eclipse time in Idaho.  The location where the sun will be is indicated, centered at coordinate (0,0).
Posted in Eddington Experiment | Leave a comment

Step EE-1, Detect the star locations in a photograph

It seems easy to locate stars in an astrophotograph: they are the bright dots.

I am recording images of the sky with my Canon EOS 60Da. It has a resolution of 5184 x 3456 pixels (after demosaic) in each of red, green and blue color channels. This is a wonderfully high resolution that exceeds the resolution of the lens and the atmosphere through which it is seeing. A “pinpoint” star is actually around 10 pixels in diameter, more if it is really bright.

And the background is not black. There is light pollution, and when the moon (or eclipsed sun) is near, there is skyglow, and there is always the background noise of the detector. All of these add up and make it more difficult to find the stars, especially if they are dim.

Here is my strategy to detect them, and then to measure their exact sub-pixel positions.

  1. Establish the local average and local variation of the background sky. This tells me what the average light level is, and the amount of random noise.
  2. Set a threshold above that noise level and detect everything that exceeds it. These will include stars and “hot pixels” (detector noise).
  3. Eliminate the isolated single pixels; they are the sensor hot pixels.
  4. For what remains, these are the “cores” of the star images. Expand the neighborhood around each. Take the weighted average of those pixels and find their geometric center. This is the star’s location in the image.

I wrote a Matlab script to do this, and applied it to various test images I have taken of the eclipse field of stars. It yields (subpixel image) coordinates of the stars it identifies. These are used as inputs to the next step.

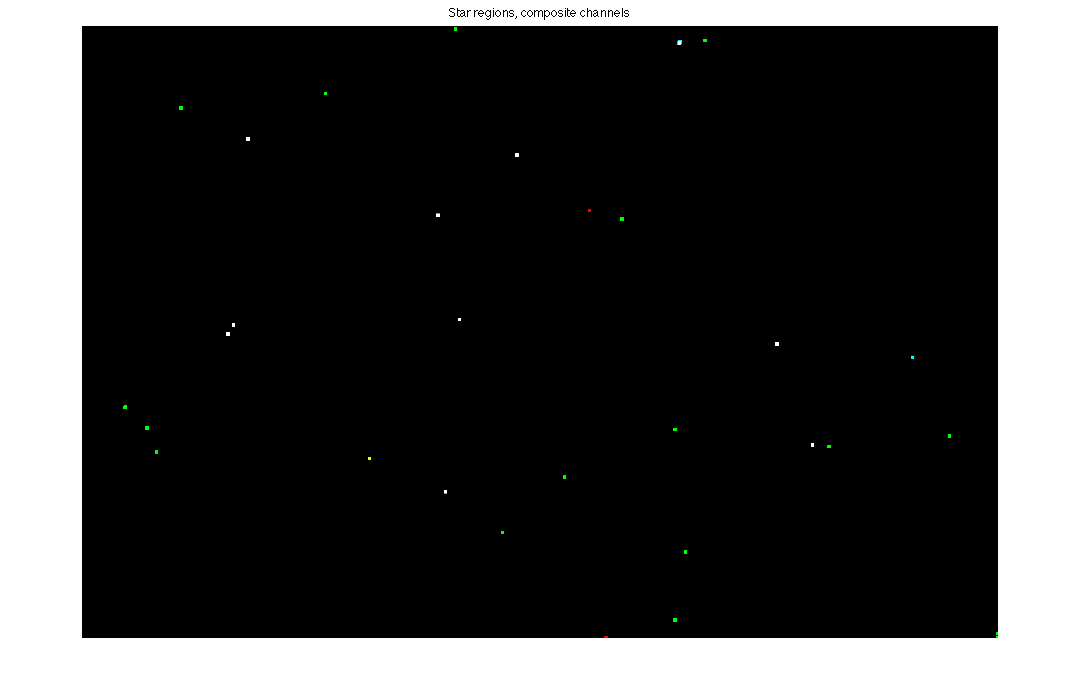
starRegionsCompositeChannelsStars detected in each of the three color channels (RGB) for the eclipse field. Not all stars are seen in all channels, and noise creates spurious stars in each channel. This exposure is 1 second at ISO 100, the best signal to noise setting on the camera.
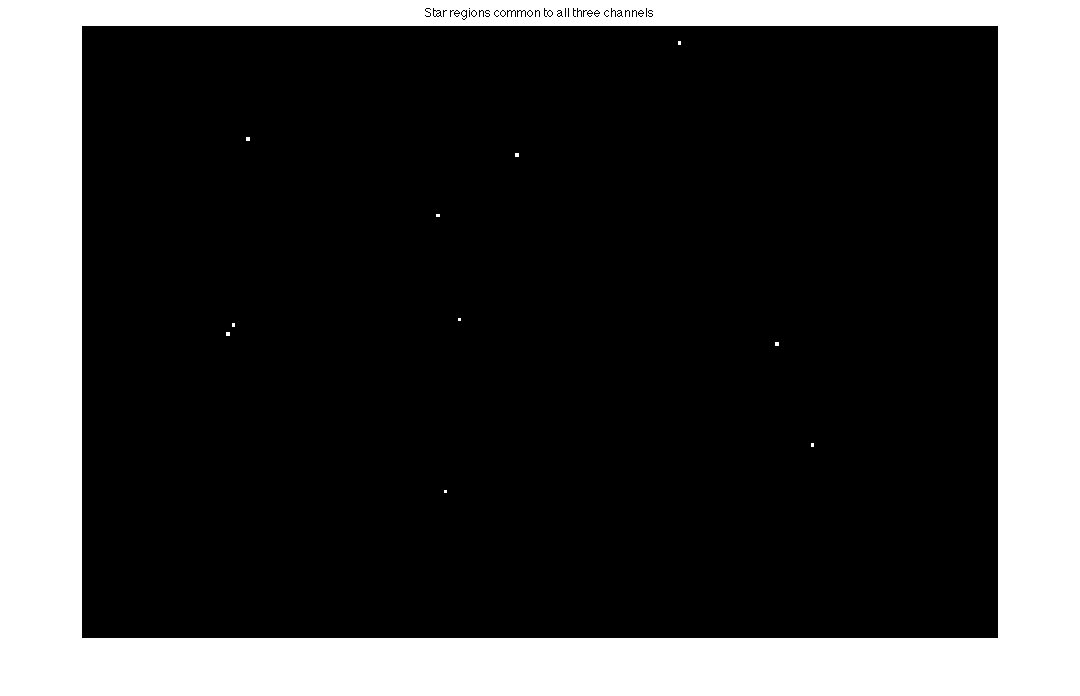
 

starRegionsCommonChannelsThe detected stars found in all three color channels. The double star to the left is Regulus (alpha Leo) and its companion.


Posted in Eddington Experiment | Leave a comment

Measuring star deflections, step by step for the Eddington Experiment.

EinsteinsAngle.png

From “Measuring Starlight Deflection during the 2017 Eclipse: Repeating the Experiment that made Einstein Famous,” Donald Bruns

Even with high quality equipment, it will be challenging to make measurements of the tiny deflections expected. There are some helpful references available on the web; some are encouraging, others are scary. Here are a few:

Measuring Starlight Deflection during the 2017 Eclipse: Repeating the Experiment that made Einstein Famous:

http://www.skyandtelescope.com/wp-content/uploads/Bruns-SAS2016-paper-v7.pdf
An update from Bruns:
my-do-it-yourself-relativity-test

http://deluxeeclipsetours.com/uncategorized/modern-eddington-experiment

https://eclipse2017.nasa.gov/testing-general-relativity

After reviewing them, is not clear to me whether my equipment and technical abilities will be able to find the small signal in a big noisy field, but I will enjoy the attempt.

Here is my star deflection measurement outline. It comprises distinct image and data processing stages, which I demark by the following labels, and will subsequently refer to:

EE-1.      Detect star locations in the “before” and “during” images. These will be pixel locations relative to the image origin (upper left corner).

EE-2.      Transform the image into a standard orientation where the sun is at the exact center, and two reference stars are at the correct relative angles to it. Do this for both before and during images.

EE-3.      Solve the “rigid point set registration” problem that best aligns the stars between the two images. Do not allow scaling, only translation and rotation.

EE-4.      Measure the radial distance from the (sun’s) center for each of the stars in the field and compare their relative values. They are expected to fall on a 1/R curve and at a value that matches Einstein’s predictions. The differences will be small, a pixel or less.


These all sound quite doable, but of course there are details. I will describe some of them for each step in what follows.  If all goes well, perhaps I will end up with a chart like Eddington’s:

t2png

Posted in Eddington Experiment | 1 Comment

A plan for 2017, but first, an introduction to celestial coordinates


RA_Dec

Astrometry is the term used for measuring the positions of the stars. It has a long history, dating from pre-telescope times, and which has introduced units that may seem archaic, but persist to this day (making them seem both arcane and archaic). Because of the Earth’s rotation, just like the sun, stars rise in the east and set in the west. The angular position in the sky depends on how many hours it has been ascending since “star-rise”.   If we pick one point in the sky as a reference, we can count the hours of ascension the star has traveled from that reference point: its “right ascension”. Right ascension (RA) is measured in hours, minutes and seconds, but is easily converted into its sky angle (24 hours equals 360 degrees).

I think of right ascension as the “horizontal” position in the sky (from east to west). The vertical coordinate, declination, is more conventional: it is the north-south angle from the Earth’s equator. These two numbers, right ascension and declination, define a star’s position in the sky.

Before photography, astrometry was conducted by aiming a fixed telescope at a specific declination angle, and the observer would watch the stars drifting through the field of view. When a target star appeared, the observer would mark the time at which it crossed the center of the view. This would be its right ascension, hence the units of time rather than angle.

When photographic emulsions became sensitive enough, the star field could be recorded and then the positions measured from the photographic plate. But because the Earth is rotating, the stars moved during the exposure, blurring their positions. This required that telescopes be equipped with “clock drives” so that they could track the star’s motion across the sky during the length of the exposure. This was the (mechanical, weight-powered) mechanism employed in Eddington’s expedition to track the sun and stars during his exposures, which lasted from 2 to 20 seconds.

As I contemplate the modern reconstruction of this experiment, I have the advantage of telescope mounts with motorized clock drives. I need only to align them with the Earth’s polar axis, and the battery-powered motors will do the rest. I also have the advantage of digital image sensors, but this comes with some tradeoffs as I hope to explain later.

The part of this experiment that will be challenging is to detect the background stars through the sun’s corona and any residual sky brightness. Eddington had the advantage of relatively bright stars, and a long, deep, period of totality. The stars we have available are at least 5 times dimmer, and totality will be two minutes, not six.

In anticipation, I have made plans to record the stars in the sun’s future gravitational neighborhood during the eclipse, and to compare them to the same field without the sun. There are two challenges. One is the practical ability to detect the starlight above the ambient light background of the sky and corona of the eclipse. The second is the technical ability to compare images taken before and during the eclipse, in order to measure the stellar deflections to subpixel accuracy.

I will outline the technical plan first, assuming that the stars will be successfully recorded on eclipse day. The issue of how to best detect them will follow.

Posted in Eddington Experiment | 1 Comment