
For help seeing the 3D effect, here are instructions for free-viewing stereo images. When you have fused them correctly, you will see the planet as a sphere, sticking out of the screen.


For help seeing the 3D effect, here are instructions for free-viewing stereo images. When you have fused them correctly, you will see the planet as a sphere, sticking out of the screen.
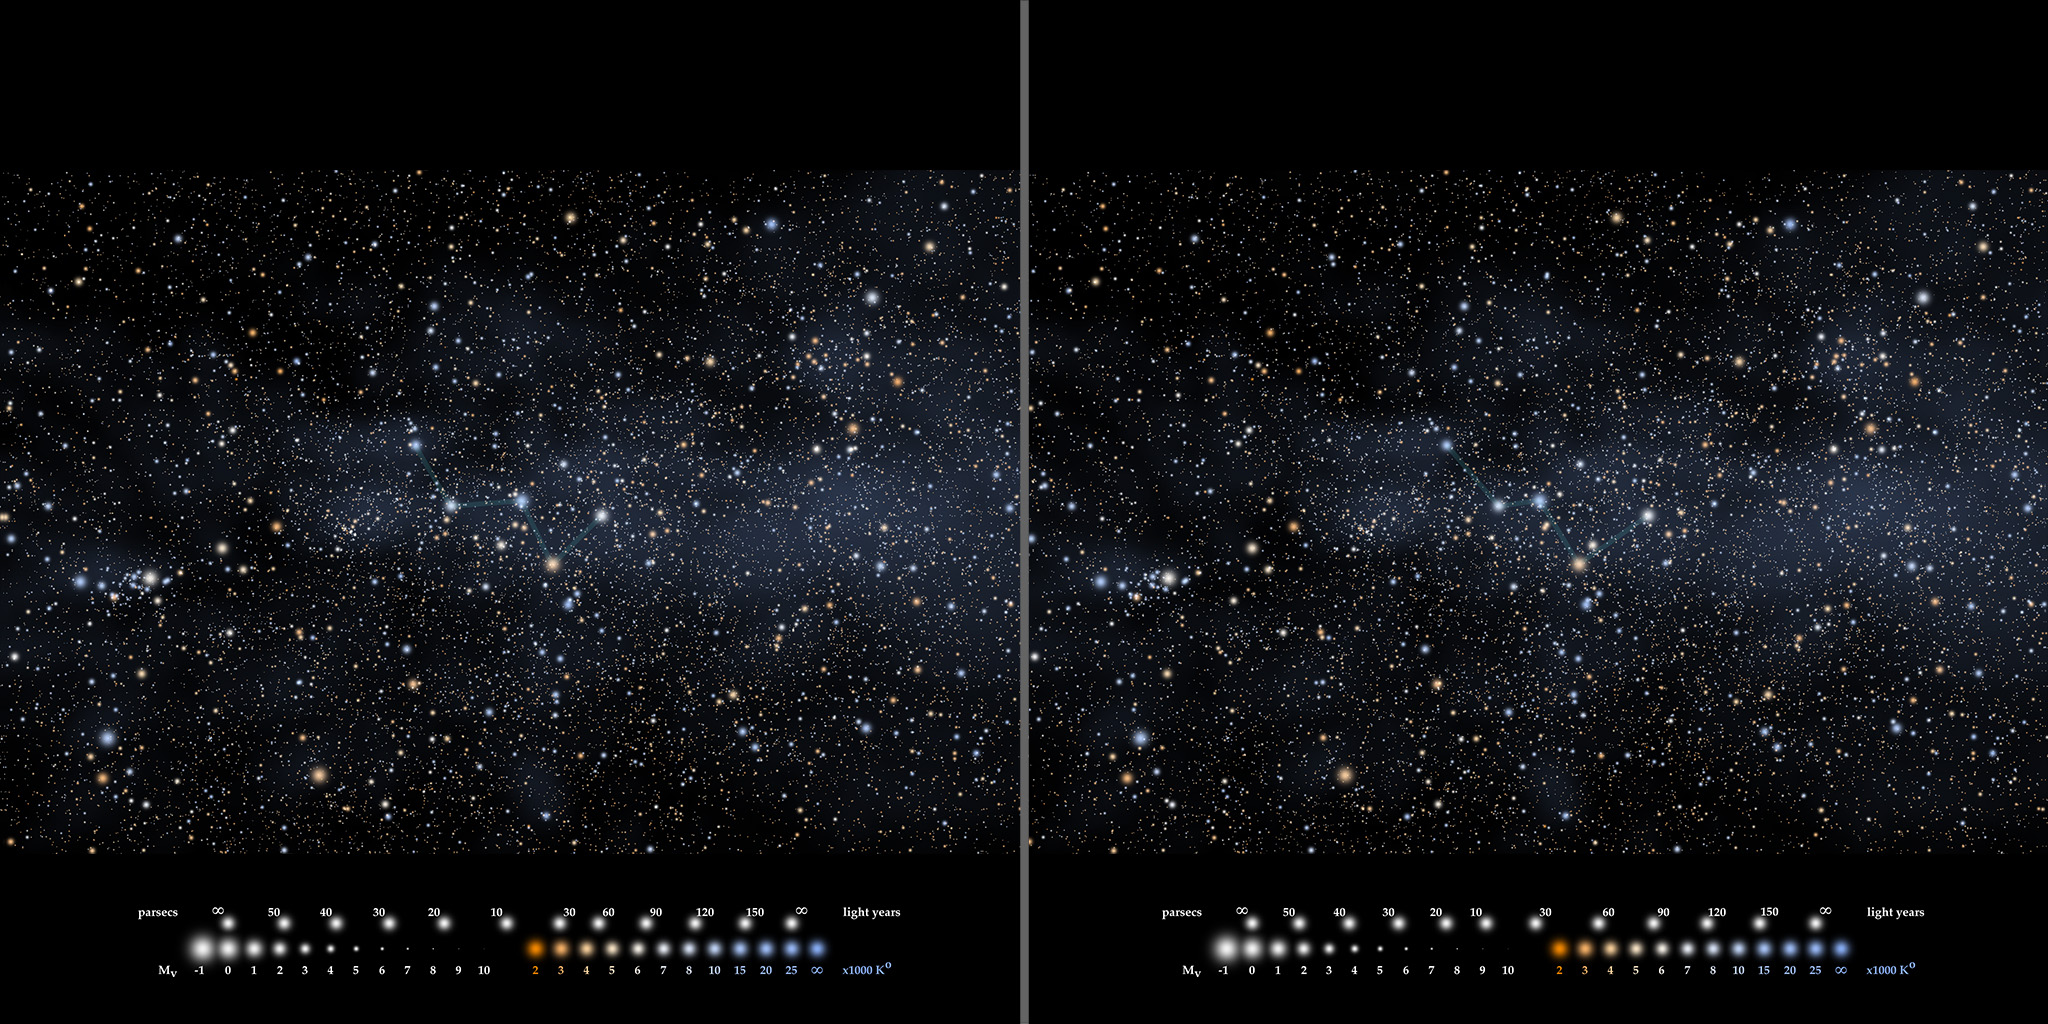
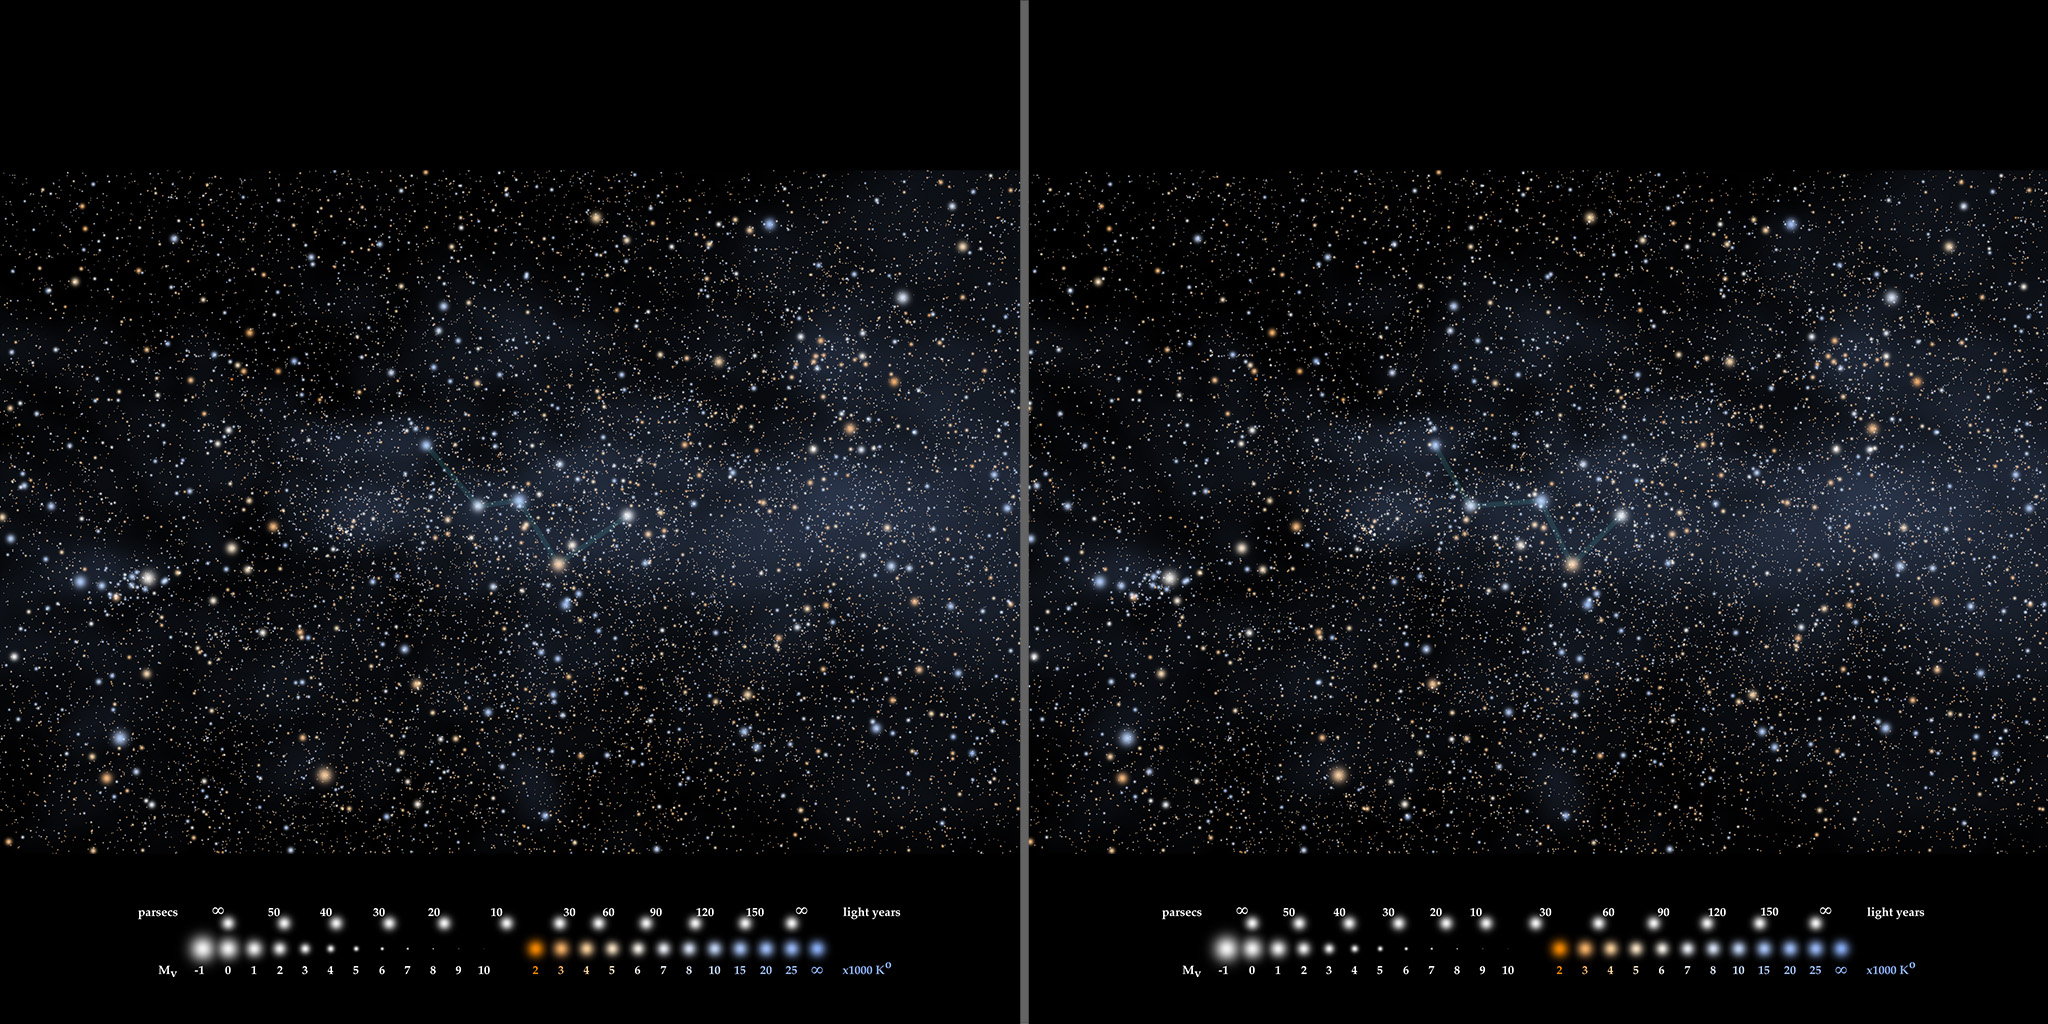
For help seeing the 3D effect, here are instructions for free-viewing stereo images. When you have fused them correctly, you will see a veil of background stars at about the screen position, and the main stars in the constellation will appear to hover above it. The distance scale progresses from infinity (at the plane of the screen) to the closest set at 10 parsecs (30 light years).

I’d like to relate how I was able to find those old stereo pair images from thirty years ago. As an early enthusiast of personal computers, I acquired habits of saving data “early and often”, because computers crashed and memory systems failed… frequently. And computer memory was limited, so I needed to store old data on external storage devices to make room for new projects. At the time I was working on these stereo images, the archival storage of choice was the CD-ROM, the precursor to DVDs. It was an amazing storage device, holding over 650 MEGABYTES on one disk! (Can you believe it?). After my publications and other work on the stereo constellation project was done, I copied the images, and the code that generated them, onto CD-ROM, knowing that I could restore them at any time if needed.
Twenty five years elapse, and I now find the need to restore them. As a packrat, however disorganized, I was able to find those old CD-ROMs, and connect a (now obsolete), CD drive to read them. Unfortunately, my computer did not recognize any data on the disks I inserted.
At first I thought it was a failure of the CD. The technology depends on the ablation of microscopic holes in a special thin surface material, and it is known that over time, the material can creep and diffuse to fill in the holes, corrupting the data. And my initial tests seemed to confirm it: newer CDs could be read, but the older ones failed.
It was discouraging. All that effort to create an archive of what I thought was important work was wasted; the data was no longer accessible.
But then I learned more. The reason I could not read the CD-ROMs was because they were recorded in a format that is no longer recognized and supported by modern computers. Somewhere in that 25 years, the rules for storing data had changed, and I was now beyond the “grandfather clause” of being able to read my stuff. I was further discouraged, but at least this brought back the possibility of being able to recover my ancient data.
I appealed to my fellow “distributed computer museum” curators, and sure enough, my friend Rich had a functioning computer with an old operating system that could recognize my old CDs! I have now transcribed my old files to new ones in a format that might last another decade or two. Of course, by then, the data will truly be obsolete!
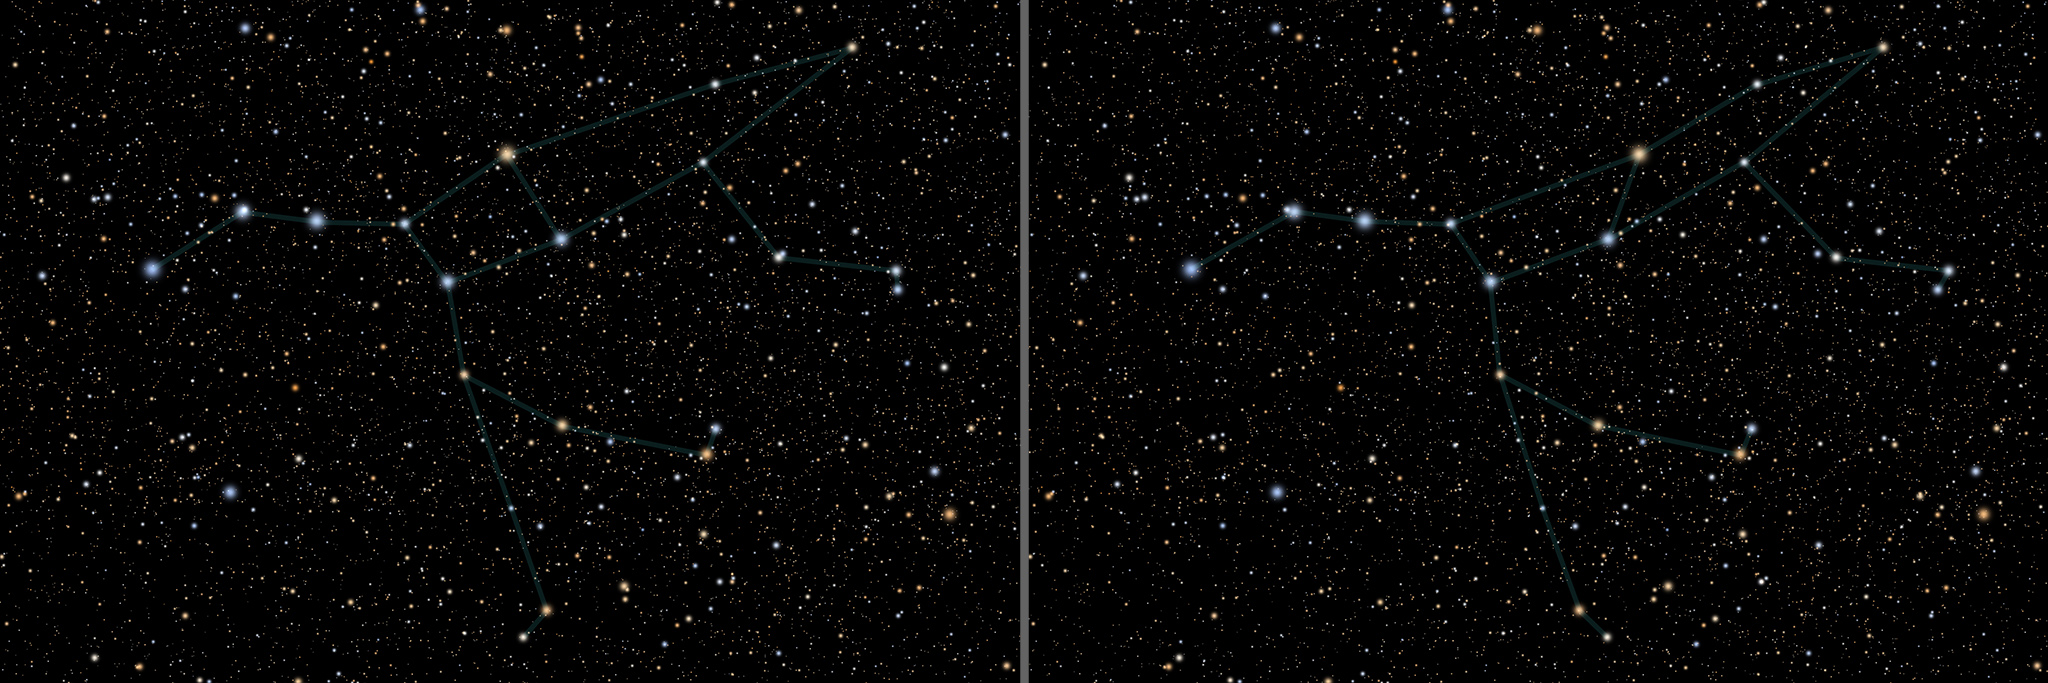
I always had a mild interest in astronomy, and it became a strong interest in the 1990s, triggered by a homework assignment given to my ten-year-old son to go out at night and identify some constellations. I took him away from the city lights to a park where we could see the stars emerge from twilight. On that beautiful fall evening, we found the constellations he was looking for, and we also saw Jupiter, the brightest object in the sky. Through binoculars, we were surprised that we could see its moons. This caused me to wonder what else I might be able to see if I were to look a little closer.
My son’s interests moved on to more important things, but my curiosity remained and drove me to learn more about the night sky. I was intrigued by the different brightnesses and colors of the stars that I could see through a small telescope. I also reviewed maps of the sky to see the patterns and locations of constellations. I found some of those maps to be more effective than others, and some to be aesthetically quite attractive. There seemed to be a correlation.
I learned that the different star colors were caused by their temperatures– duh. I also learned their brightness depended on size and proximity. Applying the methods of color science, I wrote a paper, “The Colors of the Stars,” which I presented at a color imaging conference. The paper still garners a few citations.
While I was preparing for that presentation, I wrote some code to make my own star maps, using what I had learned. And since, at the time, I was also experimenting with 3D images, I made several sets of stereo pairs. I thought they were both attractive and informative so I posted them on my fledgling website, nightscapes.net.
I recently had a request from someone who had seen those stereo images and kept a link to them for the last two decades. He was disappointed that the link no longer worked. Websites evolve, and links often break, but in this case, my early hand-crafted site had been completely replaced. The star color work and stereo pairs got left behind.
I wondered if I could reproduce those star maps. Not only do websites evolve, but so do computers, their operating systems, and their programming tools. I am no longer able to resurrect those old programs and scripts.
But I have been able to locate some of the images I made back then (see how), and I have placed them on new pages for those afficionados of 3D stereo images. Follow the links to see the stereo constellations (and stereo planets) that I made nearly thirty years ago.
Index of stereo image pairs
A preview of the brightness and color representations used in the stereo starfields:


Twin paradox, by Dr Don Lincoln of Fermilab (very unsatisfying, very unusual for Dr Lincoln, but maybe it will work for you).
Twin paradox: the real explanation
Twin paradox: the real explanation (no math)
Sabine Hossenfelder
This is the best explanation I encountered, but viewing it the first time, I still did not understand to my satisfaction. Now it makes perfect sense.
Special Relativity: This Is Why You Misunderstand It
Dr Lincoln feels the need to respond
Does acceleration solve the twin paradox?
The YouTube series that helped me finally understand it.
Relativity by eigenchris
Space travel calculator. I used this to build my acceleration chart
https://www.calctool.org/relativity/space-travel
Wikipedia entry on twins paradox:
https://en.wikipedia.org/wiki/Twin_paradox
Flying atomic clocks around the world:
https://en.wikipedia.org/wiki/Hafele–Keating_experiment
I keep coming back to this topic; click “more” for more.
The symmetry argument made in the twins paradox is now broken, but what is it about those non-inertial events that prevents us from considering the separate legs of space travel—away and back, as two independent segments of a single inertial worldline? Something must be happening at that transition point. Are the g-forces responsible for the time discrepancy?
This is what I thought after recognizing the asymmetry. But it turns out this is a red herring.
The B worldline reaches the destination and then abruptly stops. At 0.6c, Ben and the spaceship would be flattened in less than a microsecond. Maybe all that time dilation would have been resolved, but Ben didn’t live to tell us about it.
Maybe if there was a more gradual deceleration, the time discrepancy could be explained. Many YouTube videos point to the acceleration as the cause of the twins’ age differences.
I thought this for a while too, and I was ready to sweep it under the general relativity rug.
But after learning special relativity from eigenchris, I no longer believe that gravity and the warped spacetime of general relativity are necessary to explain it.
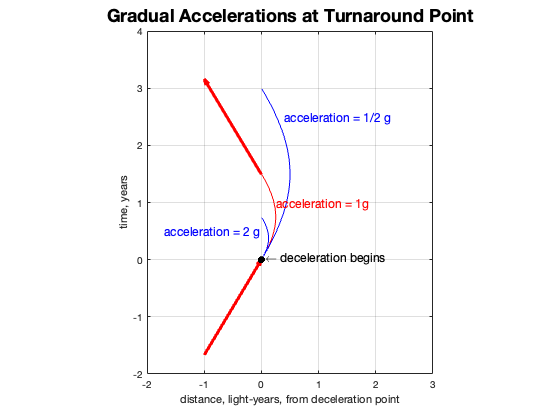
It is possible to measure time dilation during acceleration and deceleration without general relativity. So I constructed a worldline for Ben that had him gently decelerating to land on a (different) exoplanet. It added time to the overall mission, but kept him alive to complete it.
The deceleration created a force on Ben, but it was limited so that he felt the equivalent of Earth’s gravity- 1g. It took almost 9 months (but he only thought it was 8) to slow down and stop at the exoplanet.
This time, B stops only long enough to collect some samples and blast off again, following a 1g acceleration curve until he reaches the 0.6c cruising speed of his spaceship, at which, like before, he spends 4 years of his proper time.
This time, when reunited, B is 4+1.3+4=9.3. A is 5+1.4+5=11.4 Ben is now 2.1 years younger than Amelia, even more than before! But then, his mission lasted longer so his clocks were in motion longer.
If we look more closely at the deceleration/acceleration segment, we find that the ratio of proper times, B/A is about 0.9 (Ben’s watch ticked 9 times on average to Amelia’s 10). What if the acceleration had been more? Or less? I explored these possibilities and found that they would take less time (or more), but the ratio of proper times remained the same!
| Decel/Accel rate | Total Distance, light years | Time, T years | Proper Time t years | Ratio t/T |
| 0.5g | 1 | 2.958 | 2.727 | 0.922 |
| 1g | 0.5 | 1.479 | 1.3636 | 0.922 |
| 2g | 0.25 | 0.7395 | 0.6818 | 0.922 |
| 10g | 0.05 | 0.1479 | 0.13636 | 0.922 |
| 100g | 0.005 | 0.01479 | 0.013636 | 0.922 |
So no matter what acceleration you applied at the turnaround point, there is no recovering of the time discrepancy between the world paths of A and B.
Returning to the same position cannot be done without incurring an acceleration. It is not possible for the twins to reunite without one or both of them exiting their inertial frame and feeling the forces of acceleration. So in a way, acceleration is necessary for the twins to get back together and compare their elapsed proper times, but it is not the “cause” of the discrepancy. Instead, it is the speed and duration of time spent in motion.
This is what finally convinced me that time dilation was more than just the effects of remote signaling from a fast-moving object, and that there was no explanation to be found in its acceleration. It was truly an effect of objects moving with respect to my local reference frame!
The twins paradox is puzzling because it is not our experience that our personal time is shifting when we move around. It does– we just never notice it. So it seems strange that biological aging can change by taking a high speed trip. But is it really any more strange than the premise that the speed of light looks the same to everyone, no matter how fast they are going? This is the actual source of the paradox. If we can accept that, then we can accept that moving clocks tick more slowly!
Returning to Ben’s experience, I suspect there is more to understand about switching between different inertial frames. That understanding can be found in general relativity theory but I will stop here, having now satisfied my lifelong mystery of the twins paradox.
This has been my attempt to explain it. If it makes sense to you, let me know.
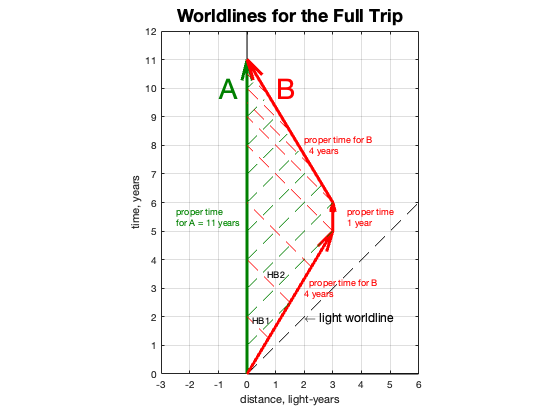
At this point, Ben stops to take his samples and make measurements and survey the exoplanet. He spends a year doing this, but he is no longer moving away from Amelia. Their clocks are each ticking at the same rate. Since they are three light years apart, it will take three years for B’s messages to be received by his twin.
After sending Happy Birthday message #5, Ben takes off for his return trip home. His spaceship is capable of traveling at 0.6c, so it will take 5 years to cover the 3 light year distance. But this is not what Ben experiences. On his calendar it only takes four!
Again, this is because at this speed the units of time for B are longer, so the clock ticks are slower in order for B to observe the speed of light in his proper time as c.
B continues to transmit the HB signals and A receives them. They are arriving delayed of course– B is still light years away, but they come more frequently now because each year B is closer and the signal transit time is shorter. It is not shorter by 0.6 years; it comes earlier than expected, 0.5 year. This is because Ben is still sending them every year on his birthday, but on his calendar, which is 1-1/4 years apart for Amelia. And in that extended time, he is even closer, so the remaining distance for the signal is shorter and takes less time, 0.5 instead of 0.6 years.
Ben finally arrives home and is now two years younger than Amelia. She has aged 5+1+5=11 years. Ben has aged 4+1+4=9 years. We have just seen how time dilation as a result of B moving close to the speed of light is the cause. His proper time along his world line is less than A’s proper time along hers.
This is not an intuitive result. It feels wrong somehow, but it is how the universe works. It has been confirmed over and over—moving clocks tick more slowly! In 1971 an experiment was run where atomic clocks were flown around the world and then compared to the reference clock on the ground. The differences were tiny but measurable– nanoseconds, and matched the theory.
But when we finally accept that this is how the universe works, we are still left with trying to explain the paradox. Why isn’t the viewpoint from Ben, where A rushes off, the exoplanet rushes in, and he remains stationary in his inertial spaceship frame, an equally valid representation?
And here is the answer—Ben is NOT in a purely inertial frame of reference. “Inertial frame of reference” means NO acceleration, no change in velocity or direction. Ben experienced both. Amelia didn’t.
An inertial frame of reference is a straight line on a spacetime diagram. While it is possible to use the Lorentz transformation to portray Ben as standing still for one of the legs of his journey, it is not possible to transform his full worldline into a single straight path. His path will always have some kink in it that takes him out of the inertial frame.
This is the crux of resolving the paradox. The two worldlines are NOT both inertial frames. There is an asymmetry in the problem. They are not equivalent. B experienced rapid deceleration followed by a change of direction and an acceleration, all of which are non-inertial conditions and not covered by the rules of special relativity.
Paradox resolved: the two perspectives are not physically equivalent, so it is not necessary that the proper times of the two paths match.
I think I can present this topic without math, but I will rely heavily on the visual tool of spacetime diagrams. Spacetime is the hybrid combination of space and time. It might sound abstract and scary, but it is really just recognizing that we travel in space and we travel in time. We can go anywhere in space, but we only go “forward” in time.
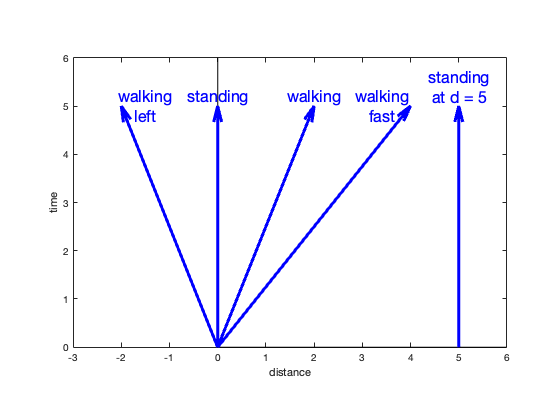
We can chart a path of our travels in spacetime on a graph where the x axis represents our relative position in space and the vertical axis is our position in time, labeled t. Yes, space is 3D, but the different directions in space can be folded into a single distance number.
If we stand still, we can plot our path in spacetime as a straight vertical line. Depending on where we are standing, the line will be somewhere on the distance axis. We can call our current position “zero”, and the line will fall on the time axis.
If we start walking to the right, the line will slant to the right as we move to further distances from our starting position. If we walk left, the line will slant left. If we walk faster, the lines will slant more. These plots are called “worldlines”.
When spacetime diagrams are used for plotting worldlines close to the speed of light, we use units of time and distance that match. Time is measured in the usual seconds, or maybe years, and distance is measured in units of how far light travels in a unit of time, so light-seconds (~30 million meters) or light-years (9.5 trillion kilometers). This choice of units results in a spacetime plot for light as falling on the 45-degree line. The speed of light is denoted by the letter c, which on the diagram is one light-year per year.
We can now depict Amelia and Ben’s worldlines. Let’s say that Ben departs at position 0, at time 0, at a velocity 60% the speed of light, 0.6c. Amelia (I will sometimes just call her “A”) follows the green worldline. Ben (“B”) charts a red path to the right with a slope that matches 0.6c—for every vertical unit of time, Ben moves to the right 0.6 units of distance. Five units of time results in covering 3 units of distance. Since the exoplanet is 3 light years away, it will take five years to reach it. Here is a plot with units of years and light-years.
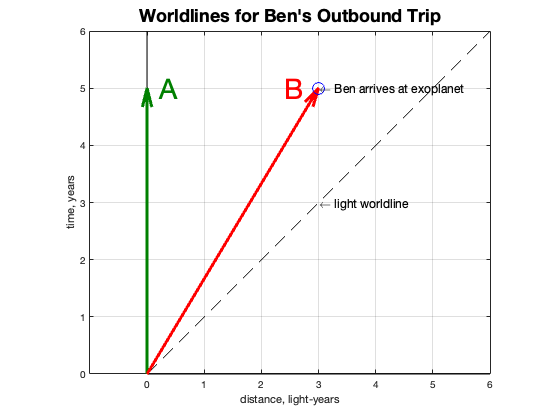
Special relativity is based on a rather unusual premise: that the speed of light is measured to be the same in all inertial frames of reference, no matter their velocity.
A consequence of this premise is that each tick of a moving clock takes longer, at least as seen by a non-moving observer. The moving observer doesn’t notice his clock ticking more slowly, but when he looks back at a non-moving clock, it appears to be the slow one.
The clock in your own inertial frame of reference tells you the “proper time”. Every observer experiences it as the normal passage of time. There is no clue that it appears slower to other reference frames. This effect of the apparent slowing of moving clocks is called “time dilation”.
Units of proper time can be depicted on the spacetime diagram by short vectors that represent one unit of time as experienced by the observer in its frame. Amelia’s units of proper time are shown as head to tail arrows along her worldline on the vertical axis. Ben’s are head to tail arrows along his worldline.
Ben’s proper time unit being longer than Amelia’s is a result of the premise: the speed of light is the same in all reference frames. As you get closer to the speed of light, in order to measure its velocity (distance per unit time) as the same, either the time units have to get larger, or the distance units have to get smaller, or both (which is what actually happens, but we are focusing on time dilation here). The lengthening of the time step is prescribed by the mathematics of relativity so that the speed of light looks the same to everyone, moving or not.
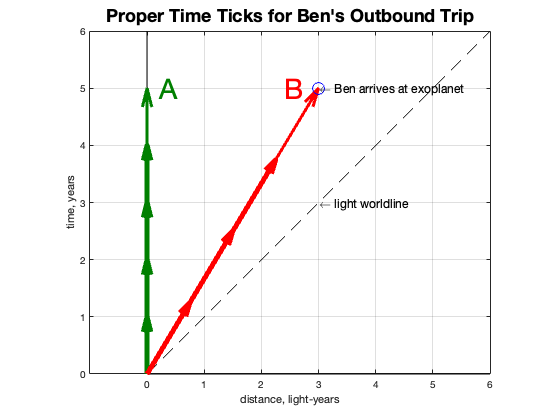
So now we have time units for each frame. Each tick of the clock moves the person on their worldline in the time direction; Amelia’s is straight up because she is staying put, and Ben’s tick is tilted up and over because he is moving in both time and position. The length of Ben’s tick has been increased to make his speed of light measurement be correct.
We can imagine that Amelia and Ben made arrangements to send happy birthday messages to each other on their common birthday, radio transmissions inserted into the telemetry stream between the spaceship and Earth. We can also imagine that they had a blast when Ben departed on their birthday.
Radio signals travel at the speed of light and so the worldlines of those transmissions fall on 45-degree diagonals. We can plot the first few of them and see what the twins experienced.
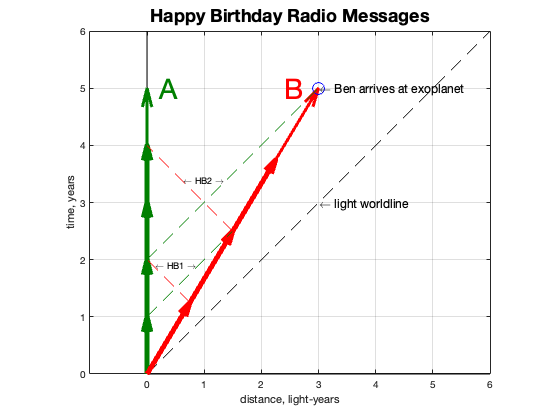
Amelia sends her first happy birthday message, HB1, one year after Ben departed. She recognized that Ben was now 0.6 light years away, and since the message had so far to travel, she didn’t expect anything from him until later that year, maybe 7 months or so.
But notice that Ben’s year is a little longer than Amelia’s, so his happy birthday message is sent “late” (even though he thinks he is exactly on time). At the time Ben sends the message, another 3 months has gone by for Amelia. And if he has been traveling for a year and 3 months, he is now more than 0.6 light years away; he is 0.75 light years distant. And from that distance it takes 9 months for the message to make it to Amelia. That additional time, plus the 3 month delay in even sending it, results in a full year before Amelia gets it. As Amelia is sending her second happy birthday message, she finally receives HB1 from Ben!
Ben also doesn’t expect to hear from Amelia each year. He knows he is traveling farther away and the signal needs additional time to reach him. And in fact, it takes two years (on B’s calendar) to receive the first message from A.
I once thought that time dilation was entirely due to the increasing distance and how long it took for the signals to get back. But it is more. B’s clock is running slow, so Ben doesn’t even send his message until three months after Amelia’s birthday. And since it was sent late because of the slowed clock, the message took longer to get back because the ship was farther away when he sent it.
This pattern continues for the rest of the trip to the exoplanet. When he lands, Ben has sent 4 birthday messages, Amelia has sent 5. B has received two of A’s five messages, and A has received 2 of B’s four.
So far we have been showing the trip from Amelia’s perspective. It might be interesting to show how it looks from Ben’s. Relativity theory provides a way to convert back and forth between inertial frames of reference. It is called the Lorentz transform and it accounts for time dilation and length contraction while always keeping the speed of light constant. Here is the spacetime diagram for Ben’s outbound trip where he is considered the “observer at rest”.
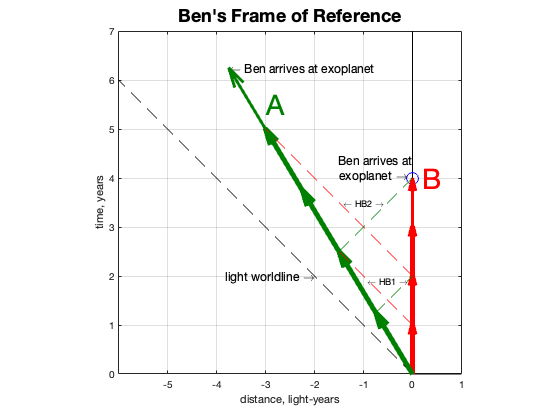
You can see that this is NOT a perfect reflection of Amelia’s perspective. She is moving left while Ben is standing still in his reference frame. Ben’s worldline runs for four years on his calendar, but Amelia’s runs for five of hers, which are longer than Ben’s, since to him, she has the moving clock. The messages they send each other arrive at the same interval in each frame, every two years, just as before. At the time Ben reaches the exoplanet, they have each received two messages.
So far there is no paradox, but Amelia and Ben have not been reunited yet, so there is no way to directly compare their relative ages.
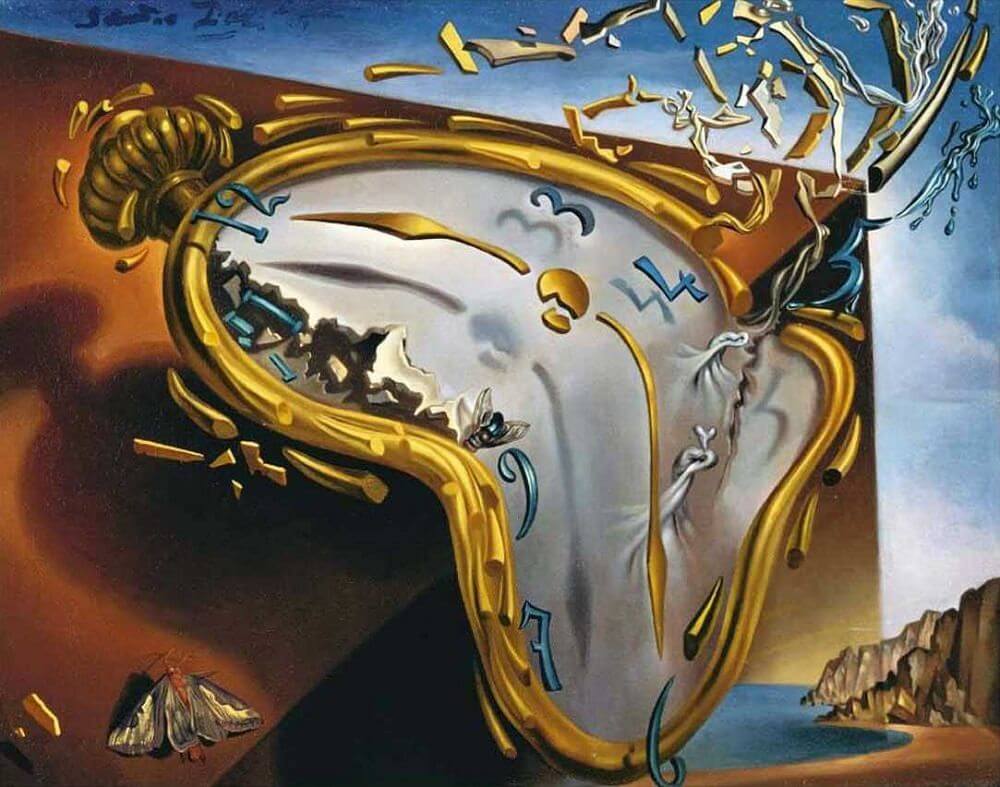

The Melting Watch, Salvador Dali, 1954
When I was studying physics in college, one of the early subjects was Einstein’s special relativity theory. The subject is called “relativity” because it explains the physics of objects moving relative to each other. It is “special” because it only applies to uniform relative motion, not motion induced by gravity, which is covered by “general” relativity, which Einstein described a decade later.
Special relativity replaced Galileo’s and Isaac Newton’s earlier theories, which were superb at explaining falling objects and orbiting planets, but had run into trouble explaining the properties of fast-moving electrons and light.
It is an early subject in the physics curriculum because as students, we were just learning the techniques of calculus and linear algebra; techniques that are helpful, but not required to understand special relativity. Most people are familiar with special relativity, and even if they don’t understand the details, they have heard “E=mc2”, one of the consequences of it. They may also have heard about time dilation, the effect of a moving clock slowing down relative to a stationary one.
Continue readingSometimes, when I try to describe to others what I do as a color scientist, I am asked if I can fix their photos. Usually it is to make their printer look more like their monitor, but a few years ago it was a friend asking about how to correct his underwater pictures while scuba diving. It turns out that this is an unsolved problem in color science and it was intriguing enough that I spent some time studying it, and worked out a solution for a simple geometry using my friend’s images as test cases.
Five years later I decided to submit a summary of this work to the international Color Imaging Conference, this year held in Lillehammer Norway. Remarkably, it was accepted, and doubly remarkably, it was runner up for the coveted “Cactus Award” for interactive poster papers.
Here are the posters I presented for this work.
Questions? Don’t hesitate to ask.
